
Metrics
The cortex get and cortex get API_NAME commands display the request time (averaged over the past 2 weeks) and response code counts (summed over the past 2 weeks) for your APIs:
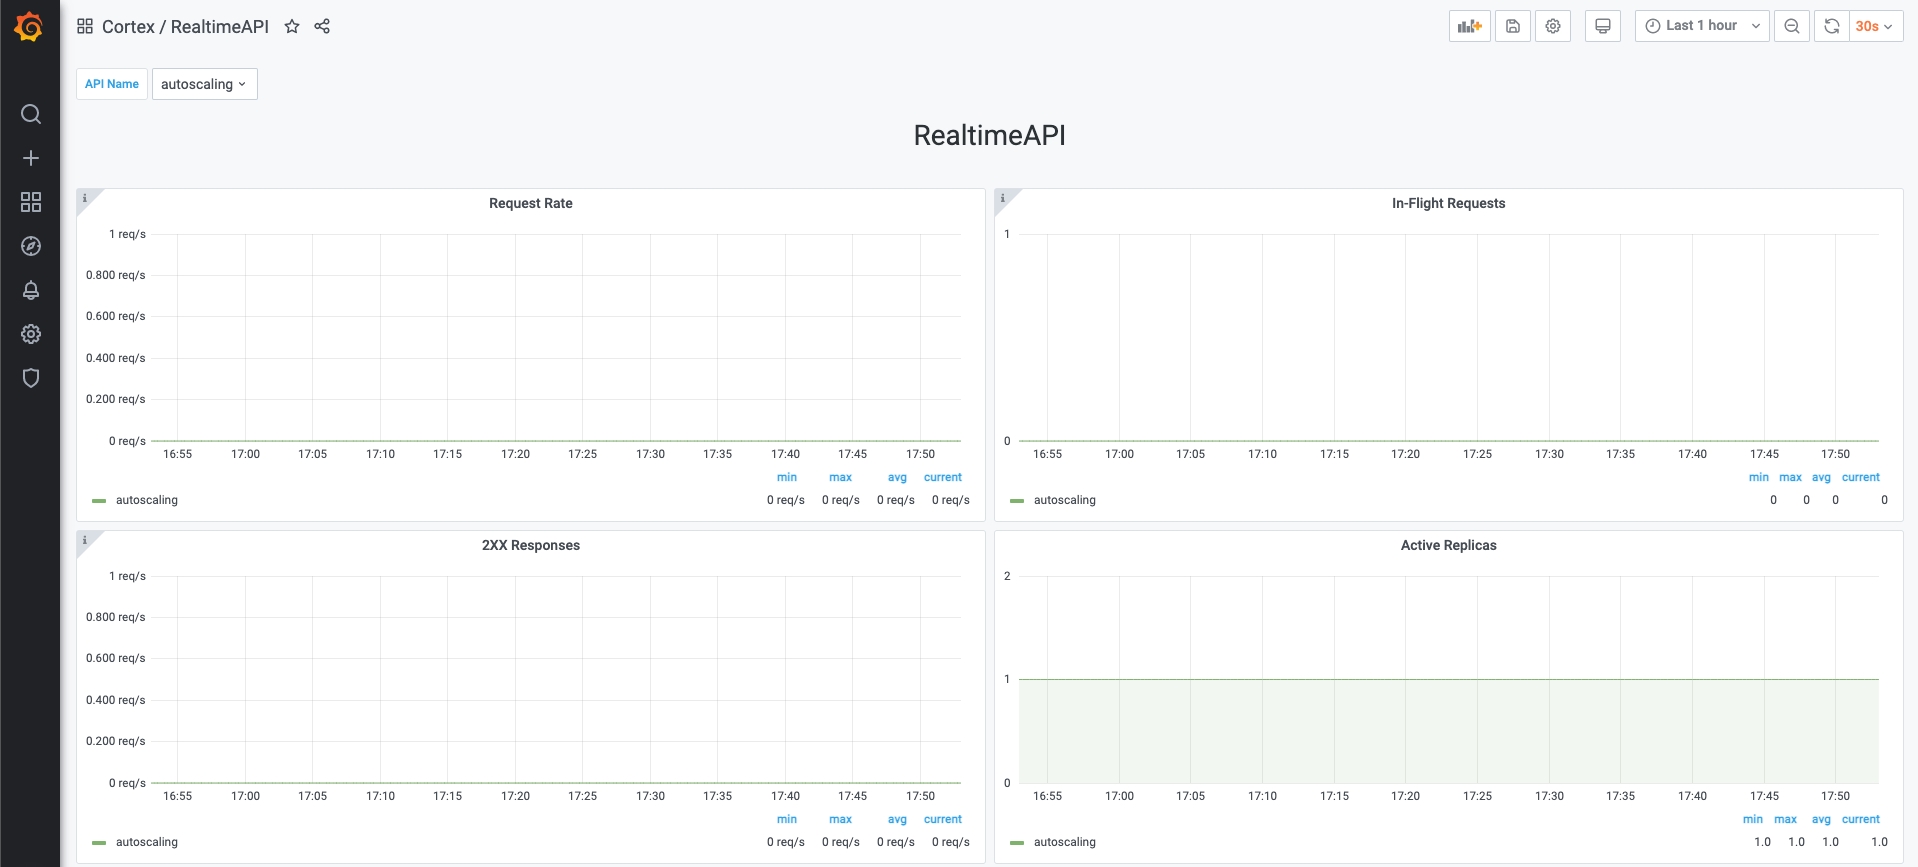
The cortex get API_NAME command also provides a link to a Grafana dashboard:
Metrics in the dashboard
Panel
Description
Note
Request Rate
Request rate, computed over every minute, of an API
In Flight Request
Active in-flight requests for an API.
In-flight requests are recorded every 10 seconds, which will correspond to the minimum resolution.
Active Replicas
Active replicas for an API
2XX Responses
Request rate, computed over a minute, for responses with status code 2XX of an API
4XX Responses
Request rate, computed over a minute, for responses with status code 4XX of an API
5XX Responses
Request rate, computed over a minute, for responses with status code 5XX of an API
p99 Latency
99th percentile latency, computed over a minute, for an API
Value might not be accurate because the histogram buckets are not dynamically set.
p90 Latency
90th percentile latency, computed over a minute, for an API
Value might not be accurate because the histogram buckets are not dynamically set.
p50 Latency
50th percentile latency, computed over a minute, for an API
Value might not be accurate because the histogram buckets are not dynamically set.
Average Latency
Average latency, computed over a minute, for an API
Custom user metrics
It is possible to export custom user metrics by adding the metrics_client argument to the handler constructor. Below there is an example of how to use the metrics client. The implementation is similar to all handler types.
Note: The metrics client uses the UDP protocol to push metrics, so if it fails during a metrics push, no exception is thrown.
Last updated