Metrics
Last updated
Last updated
The cortex get and cortex get API_NAME commands display the request time (averaged over the past 2 weeks) and response code counts (summed over the past 2 weeks) for your APIs:
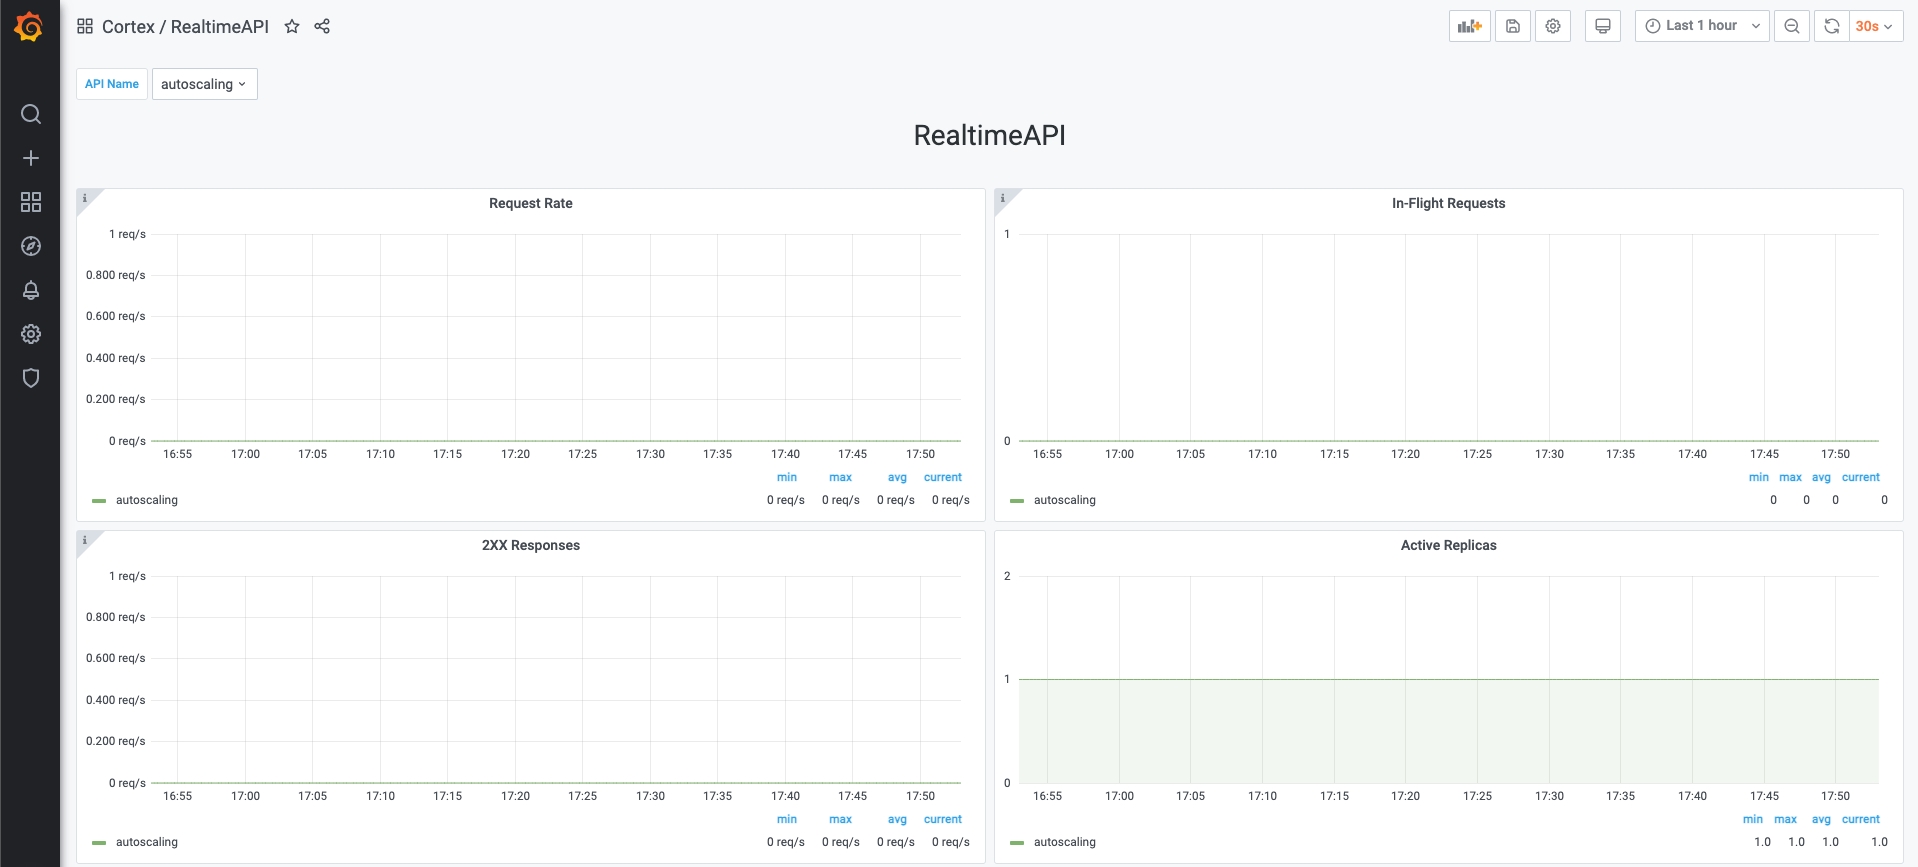
The cortex get API_NAME command also provides a link to a Grafana dashboard:
Panel
Description
Note
Request Rate
Request rate, computed over every minute, of an API
In Flight Request
Active in-flight requests for an API.
In-flight requests are recorded every 10 seconds, which will correspond to the minimum resolution.
Active Replicas
Active replicas for an API
2XX Responses
Request rate, computed over a minute, for responses with status code 2XX of an API
4XX Responses
Request rate, computed over a minute, for responses with status code 4XX of an API
5XX Responses
Request rate, computed over a minute, for responses with status code 5XX of an API
p99 Latency
99th percentile latency, computed over a minute, for an API
Value might not be accurate because the histogram buckets are not dynamically set.
p90 Latency
90th percentile latency, computed over a minute, for an API
Value might not be accurate because the histogram buckets are not dynamically set.
p50 Latency
50th percentile latency, computed over a minute, for an API
Value might not be accurate because the histogram buckets are not dynamically set.
Average Latency
Average latency, computed over a minute, for an API
The dashboard URL is displayed once you run a cortex get <api_name> command.
Alternatively, you can access it on http://<operator_url>/dashboard. Run the following command to get the operator URL:
The dashboard is protected with username / password authentication, which by default are:
Username: admin
Password: admin
You will be prompted to change the admin user password in the first time you log in.
Grafana allows managing the access of several users and managing teams. For more information on this topic check the grafana documentation.
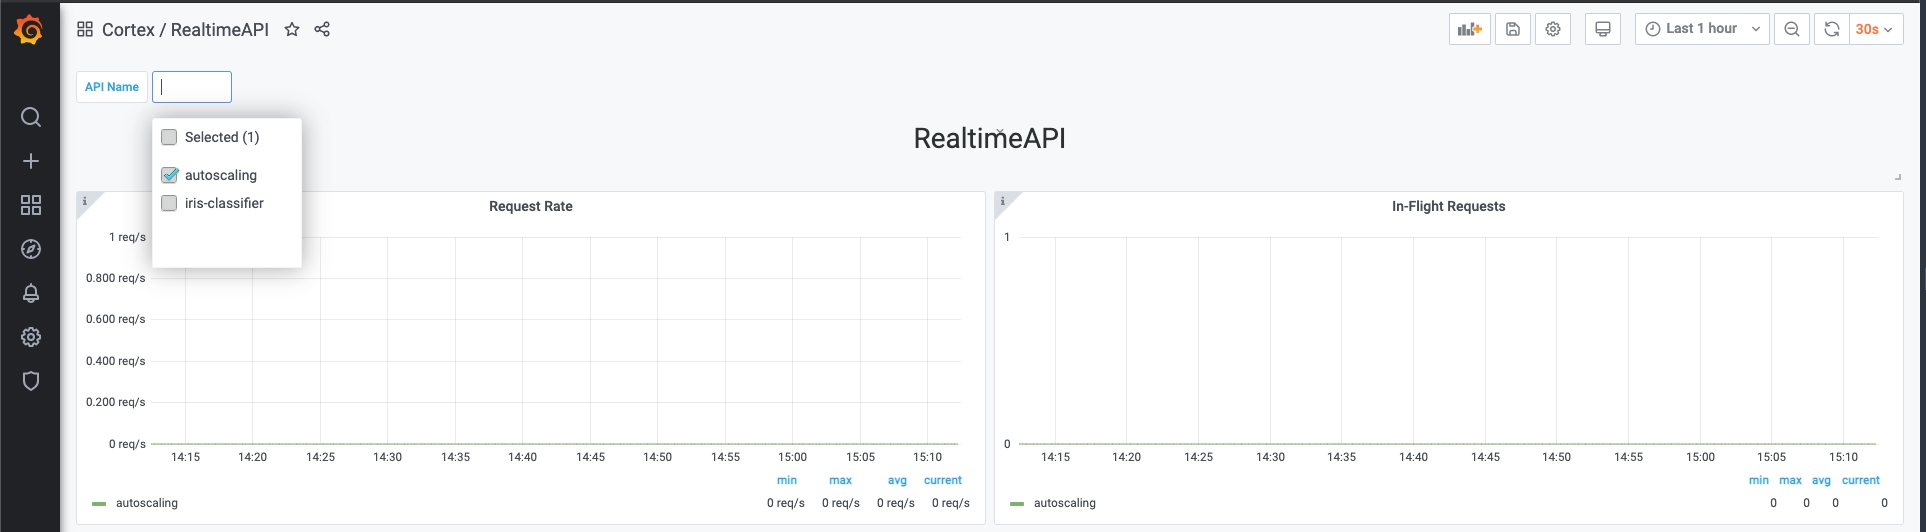
You can select one or more APIs to visualize in the top left corner of the dashboard.
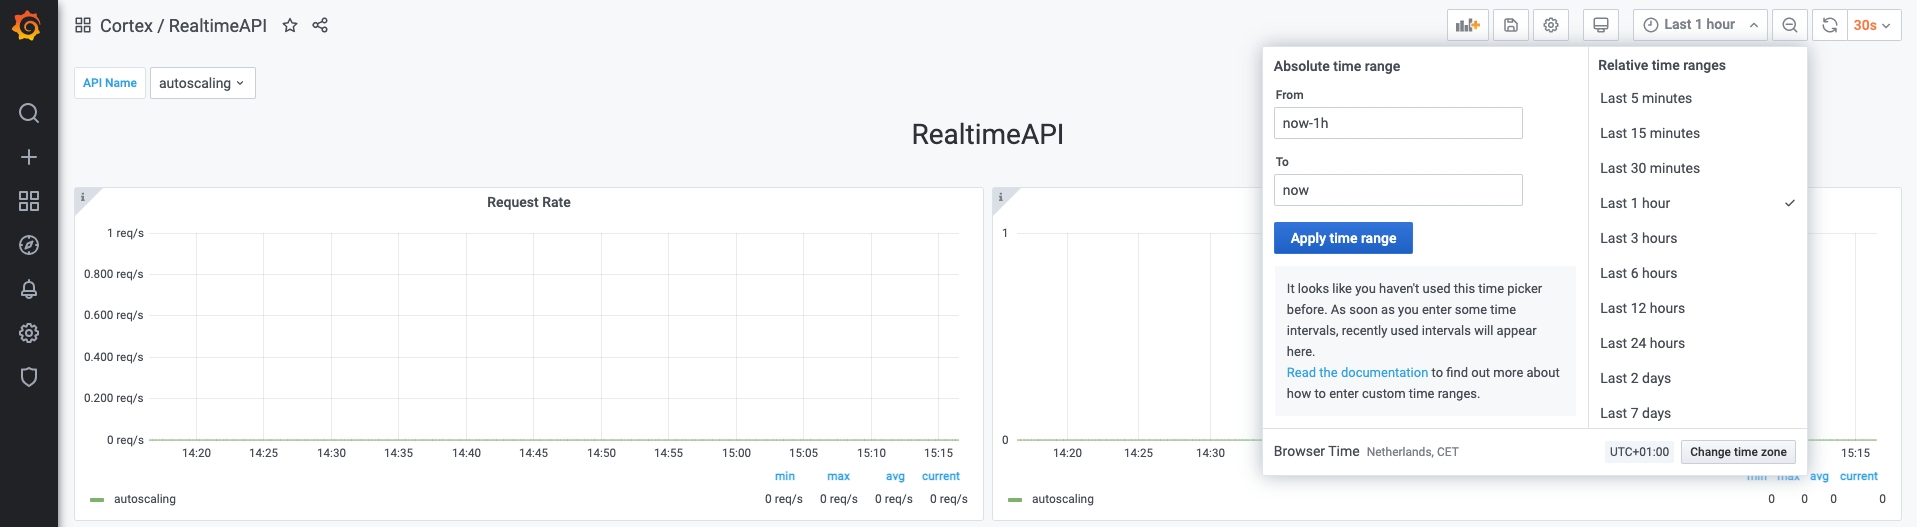
Grafana allows you to select a time range on which the metrics will be visualized. You can do so in the top right corner of the dashboard.
Note: Cortex only retains a maximum of 2 weeks worth of data at any moment in time
There are more than one dashboard available by default. You can view the available dashboards by accessing the Grafana menu: Dashboards -> Manage -> Cortex folder.
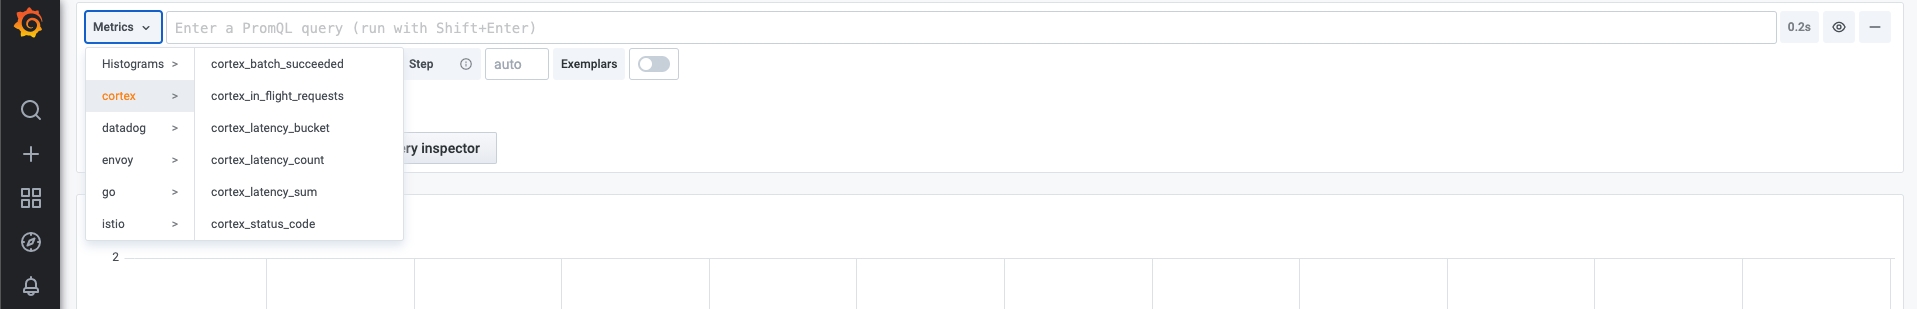
Cortex exposes more metrics with Prometheus, that can be potentially useful. To check the available metrics, access the Explore menu in grafana and press the Metrics button.
You can use any of these metrics to set up your own dashboards.