Alerting
Cortex supports setting alerts for your APIs out-of-the-box. Alerts are an effective way of identifying problems in your system as they occur.
The following dashboards can be configured with alerts:
RealtimeAPI
BatchAPI
Cluster resources
Node resources
This page demonstrates the process for configuring alerts for a realtime API. The same principles apply to the others as well. Alerts can be configured for a variety of notification channels such as for Slack, Discord, Microsoft Teams, PagerDuty, Telegram and traditional webhooks. In this example, we'll use Slack.
If you don't know how to access the Grafana dashboard for your API, make sure you check out this page first.
Create a Slack channel
Create a slack channel on your team's Slack workspace. We'll name ours "cortex-alerts".
Add an Incoming Webhook to your channel and retrieve the webhook URL. It will look like something like https://hooks.slack.com/services/<XXX>/<YYY>/<ZZZ>.
Create a Grafana notification channel
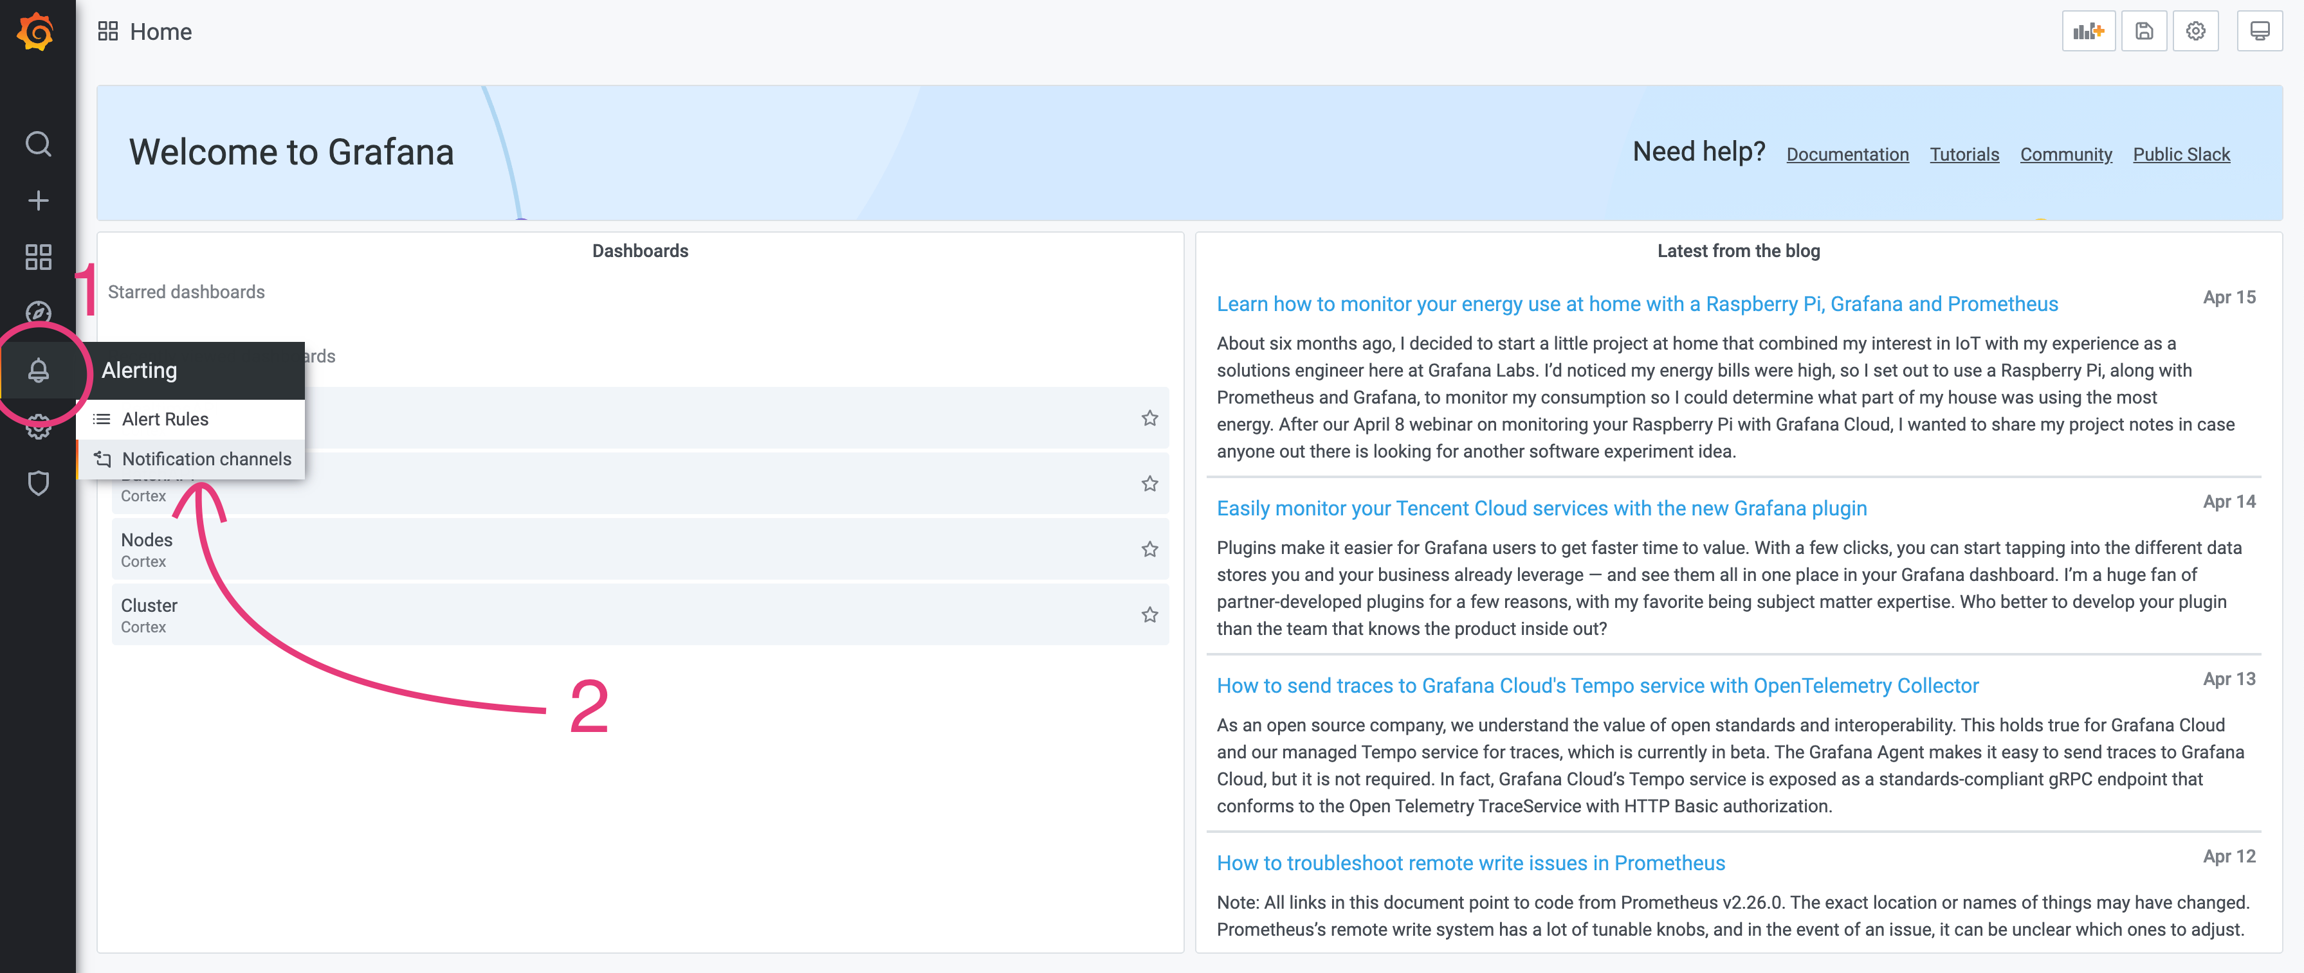
Go to Grafana and on the left-hand side panel, hover over the alerting bell and select "Notification channels".
Click on "Create channel", add the name of your channel, select Slack as the type of the channel, and paste your Slack webhook URL.
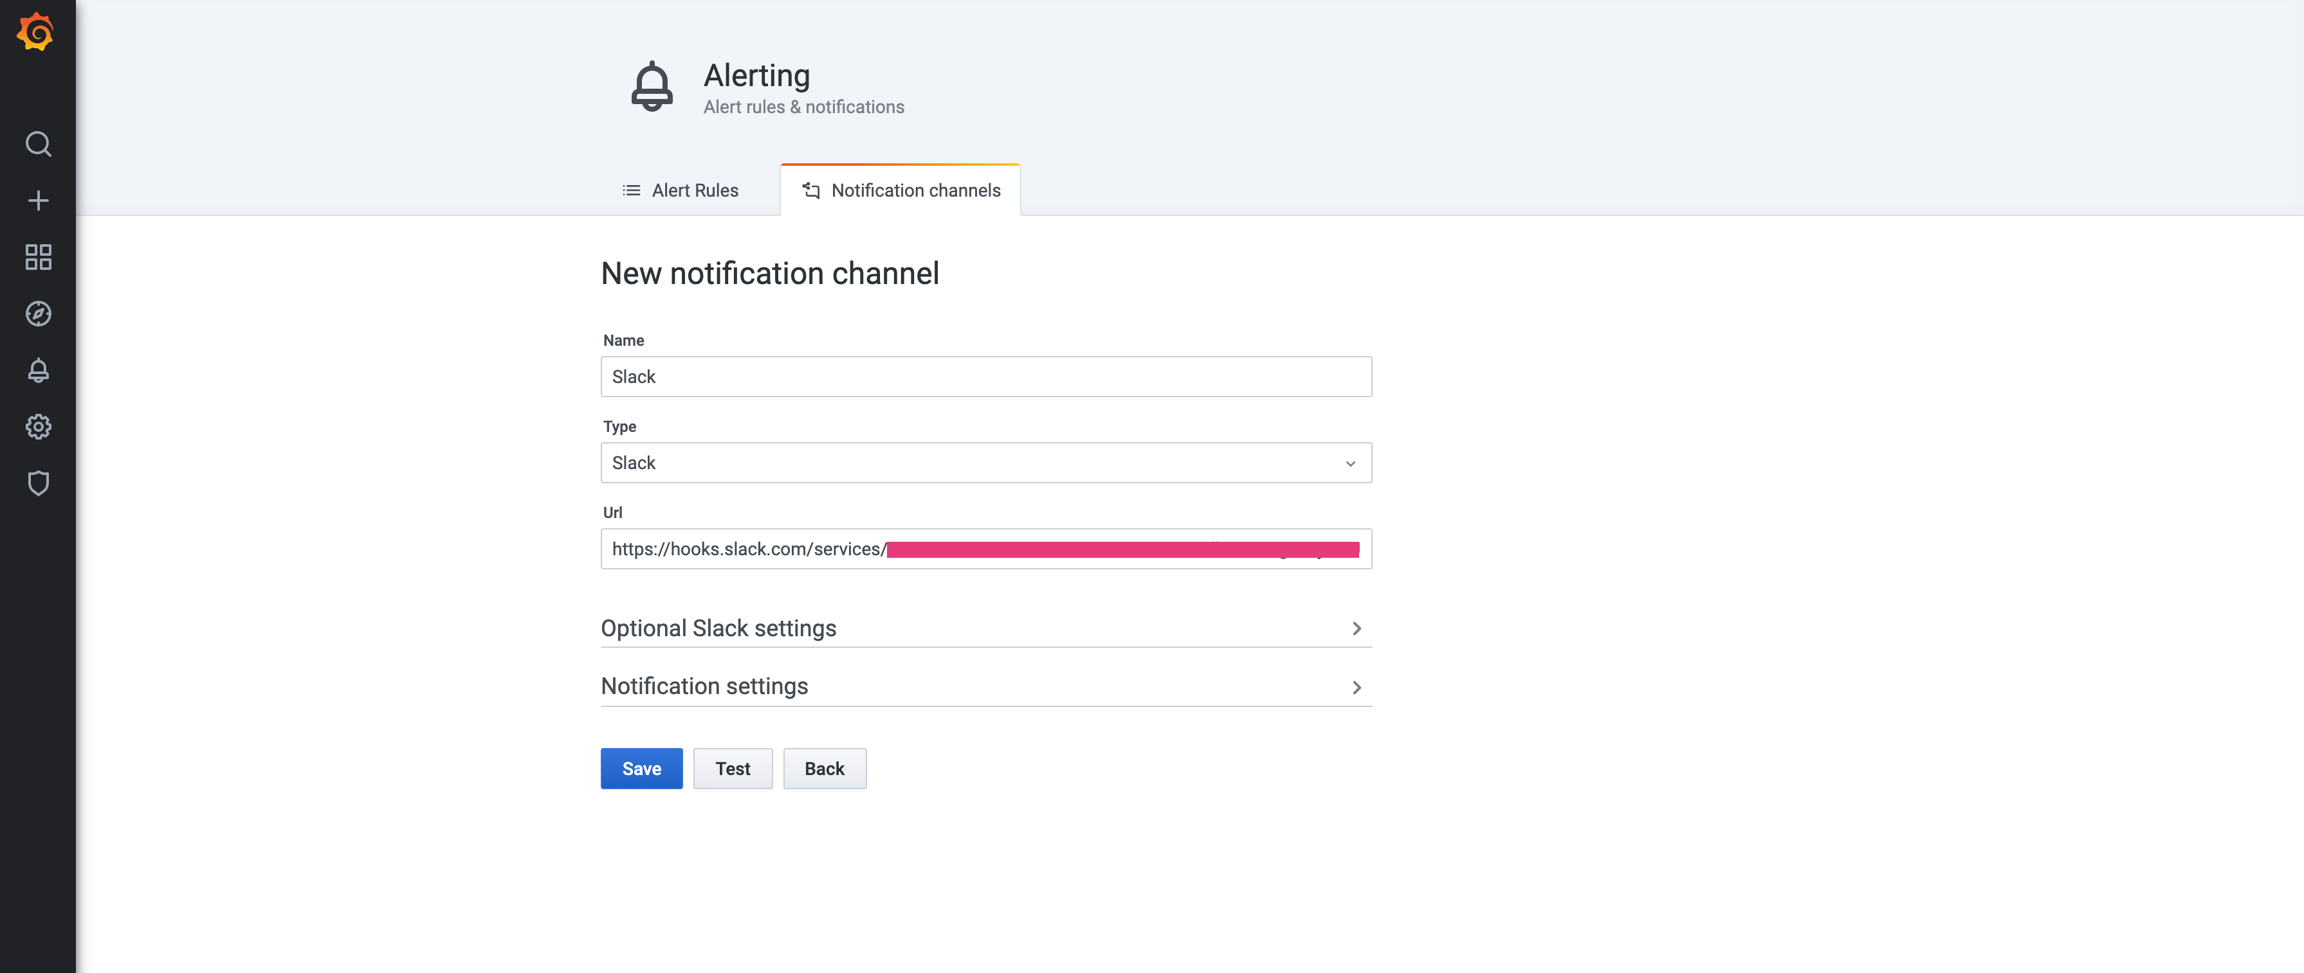
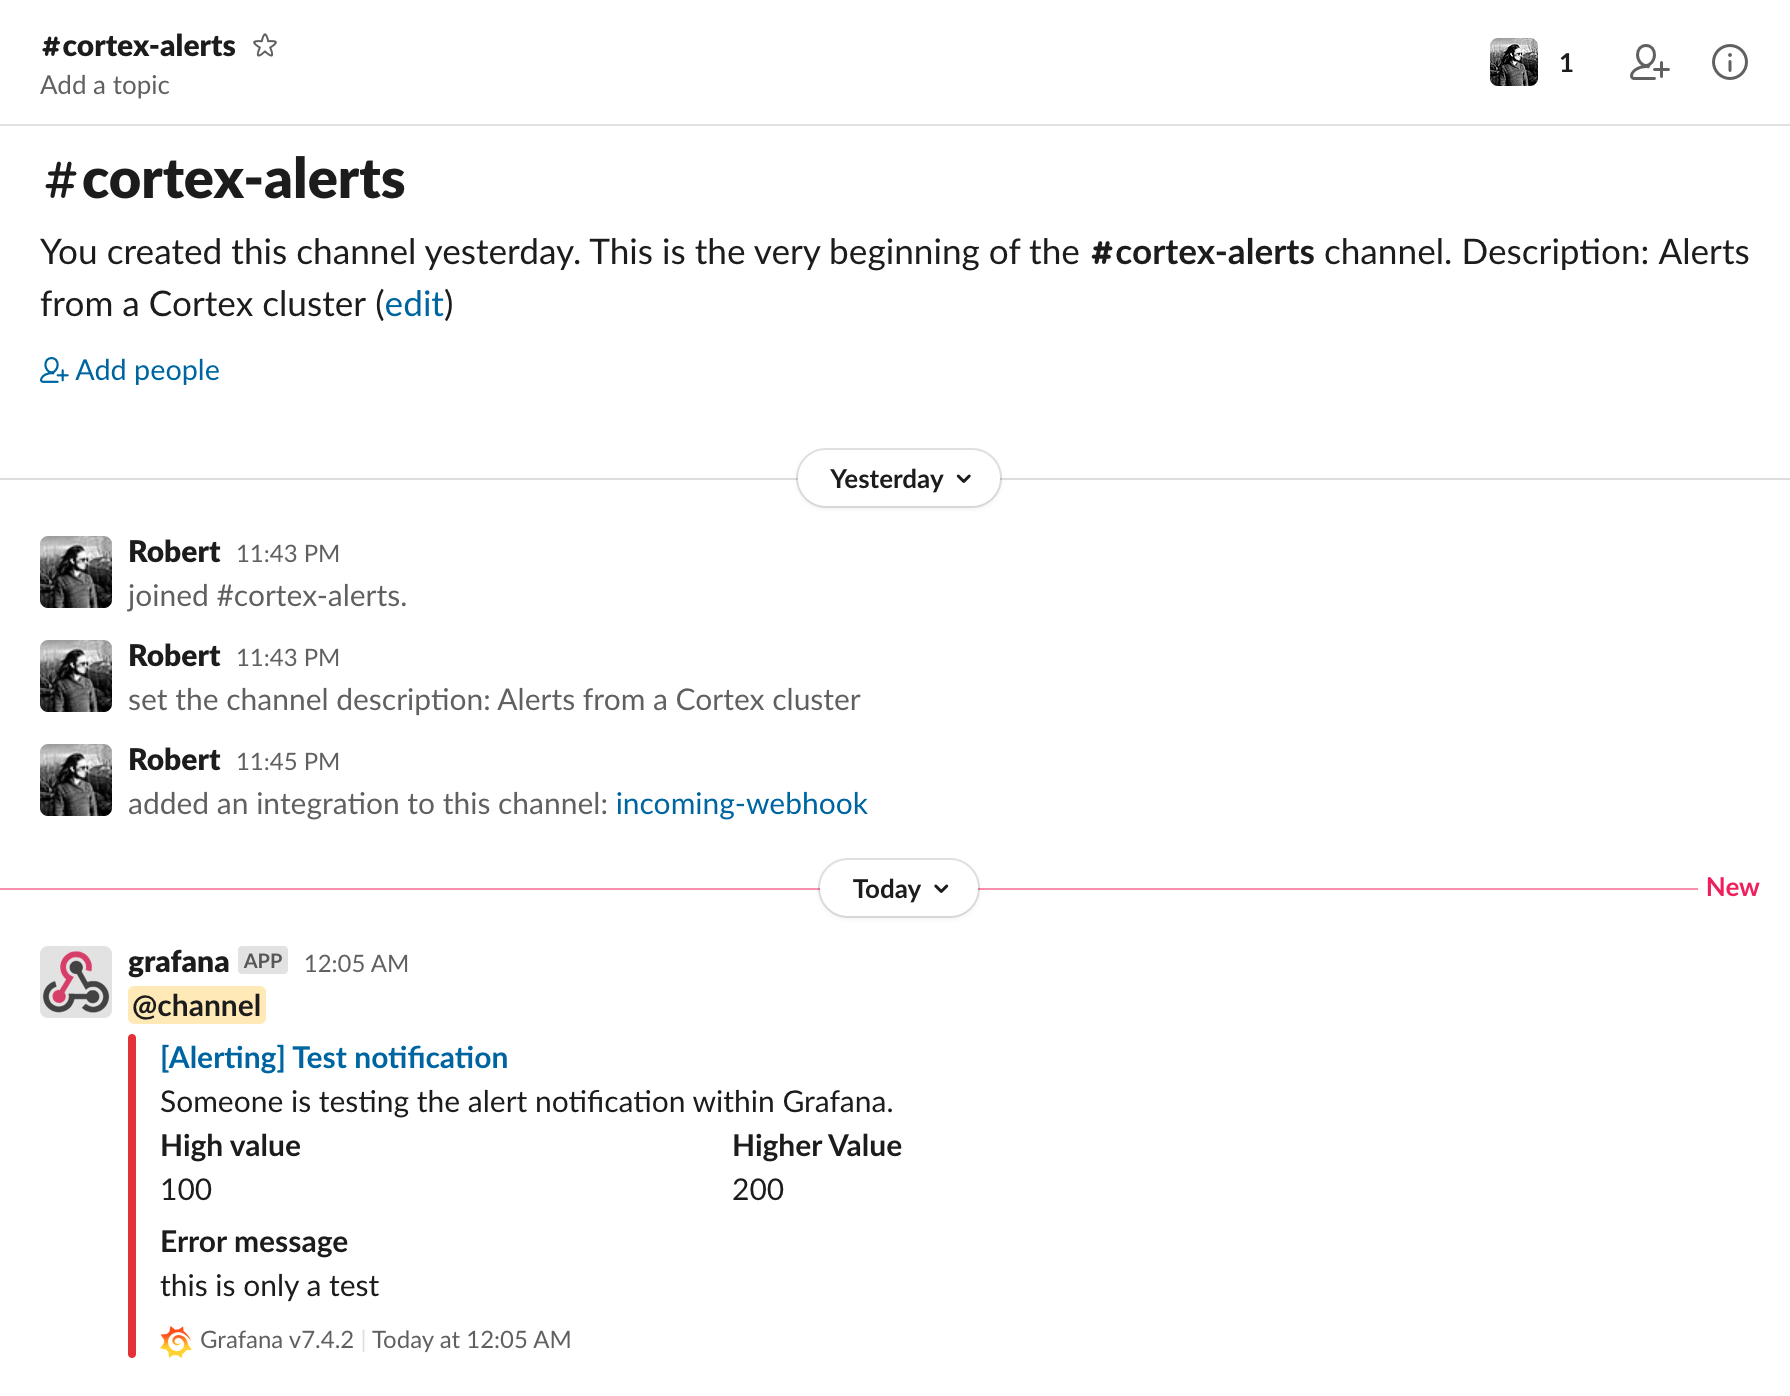
Click "Test" and see if a sample notification is sent to your Slack channel. If the message goes through, click on "Save".
Create alerts
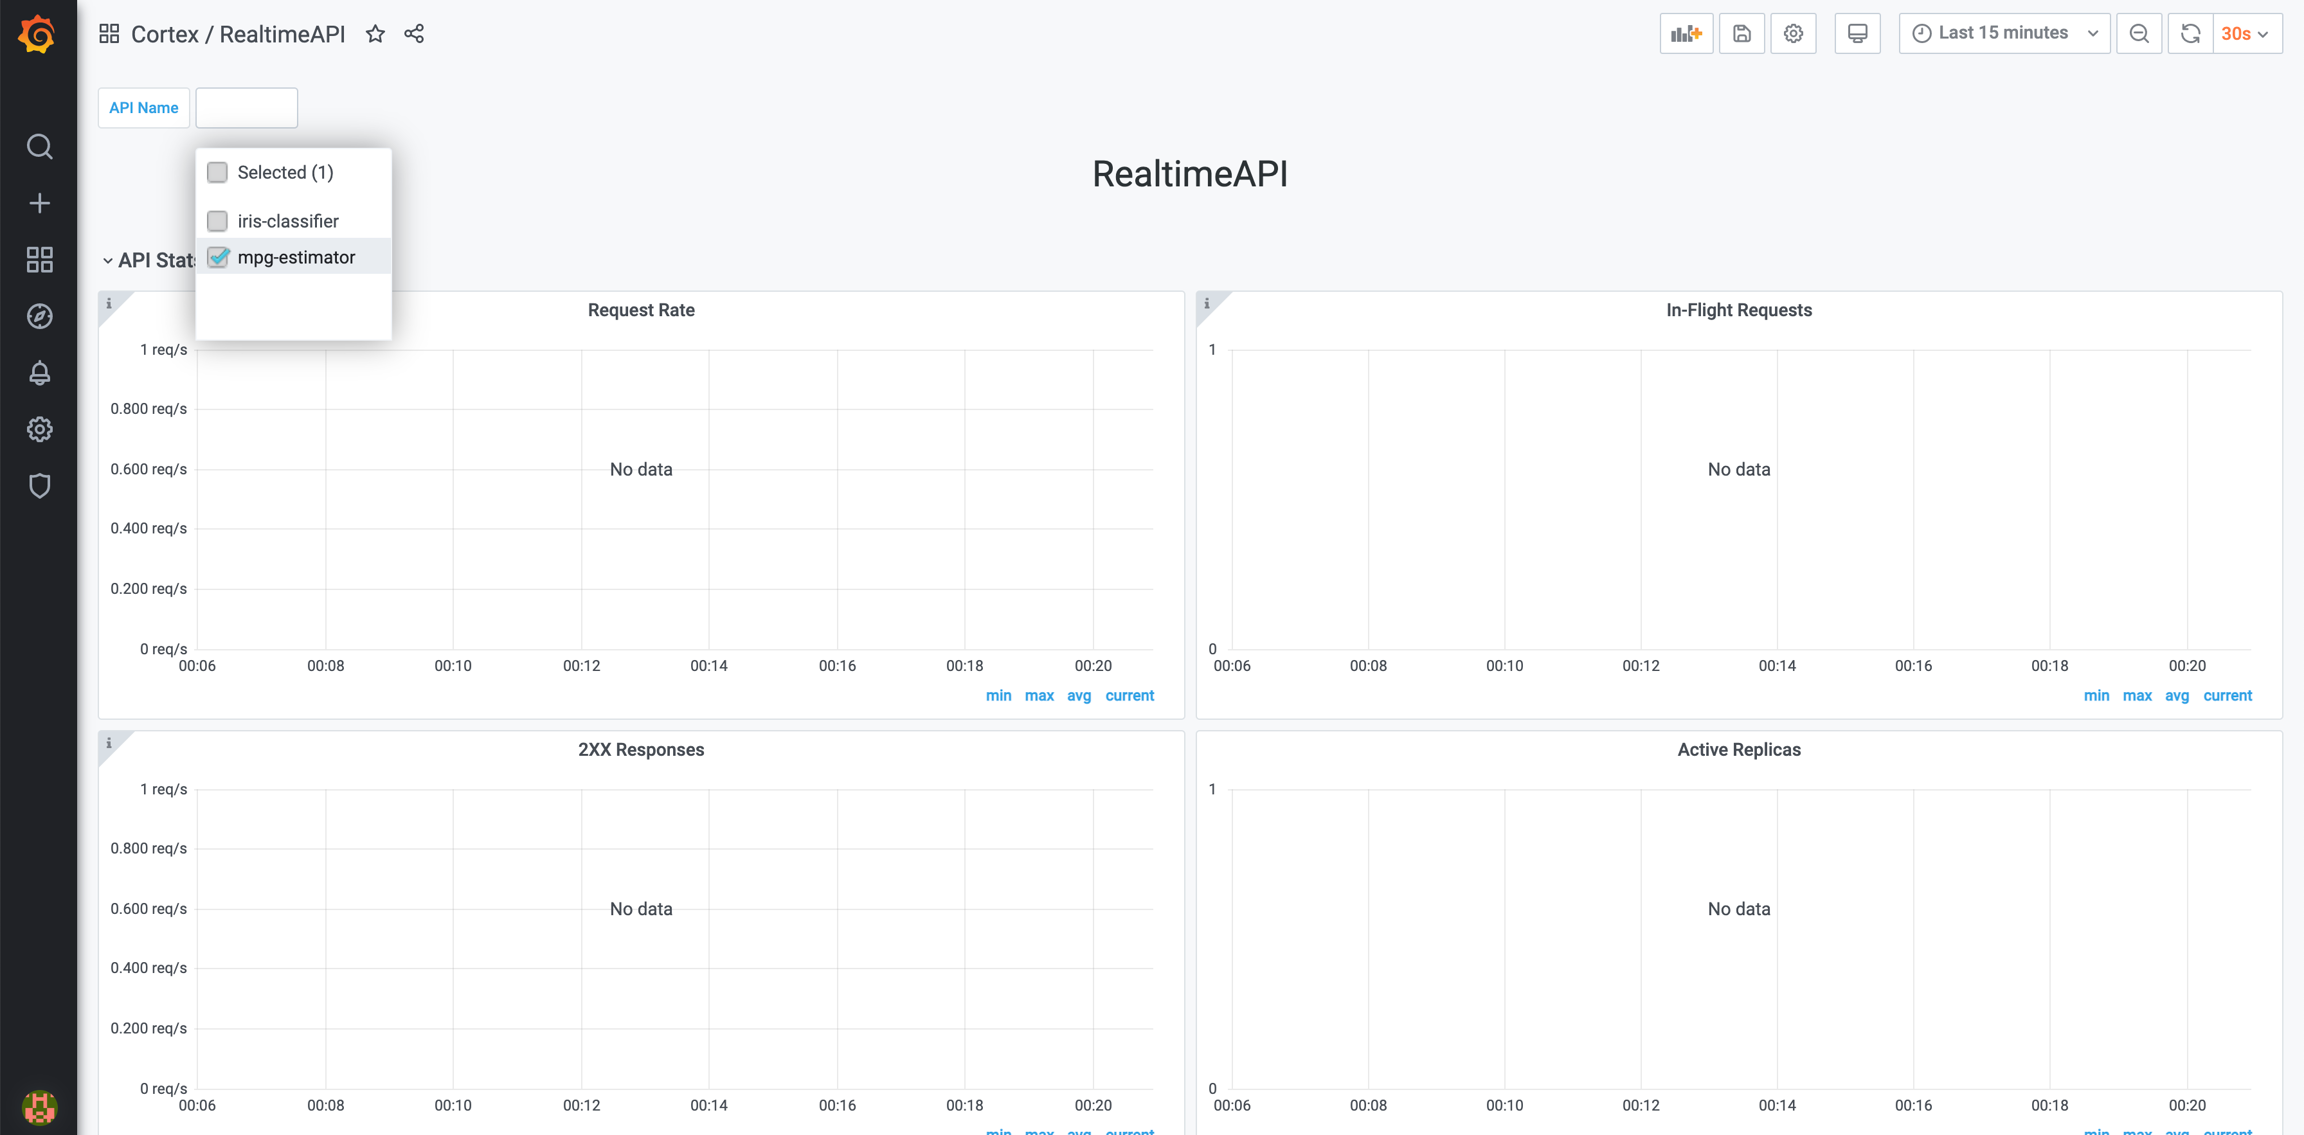
Now that the notification channel is functioning properly, we can create alerts for our APIs and cluster. For all of our examples, we are using the mpg-estimator API as an example.
API replica threshold alert
Let's create an alert for the "Active Replicas" panel. We want to send notifications every time the number of replicas for the given API exceeds a certain threshold.
Edit the "Active Replicas" panel.
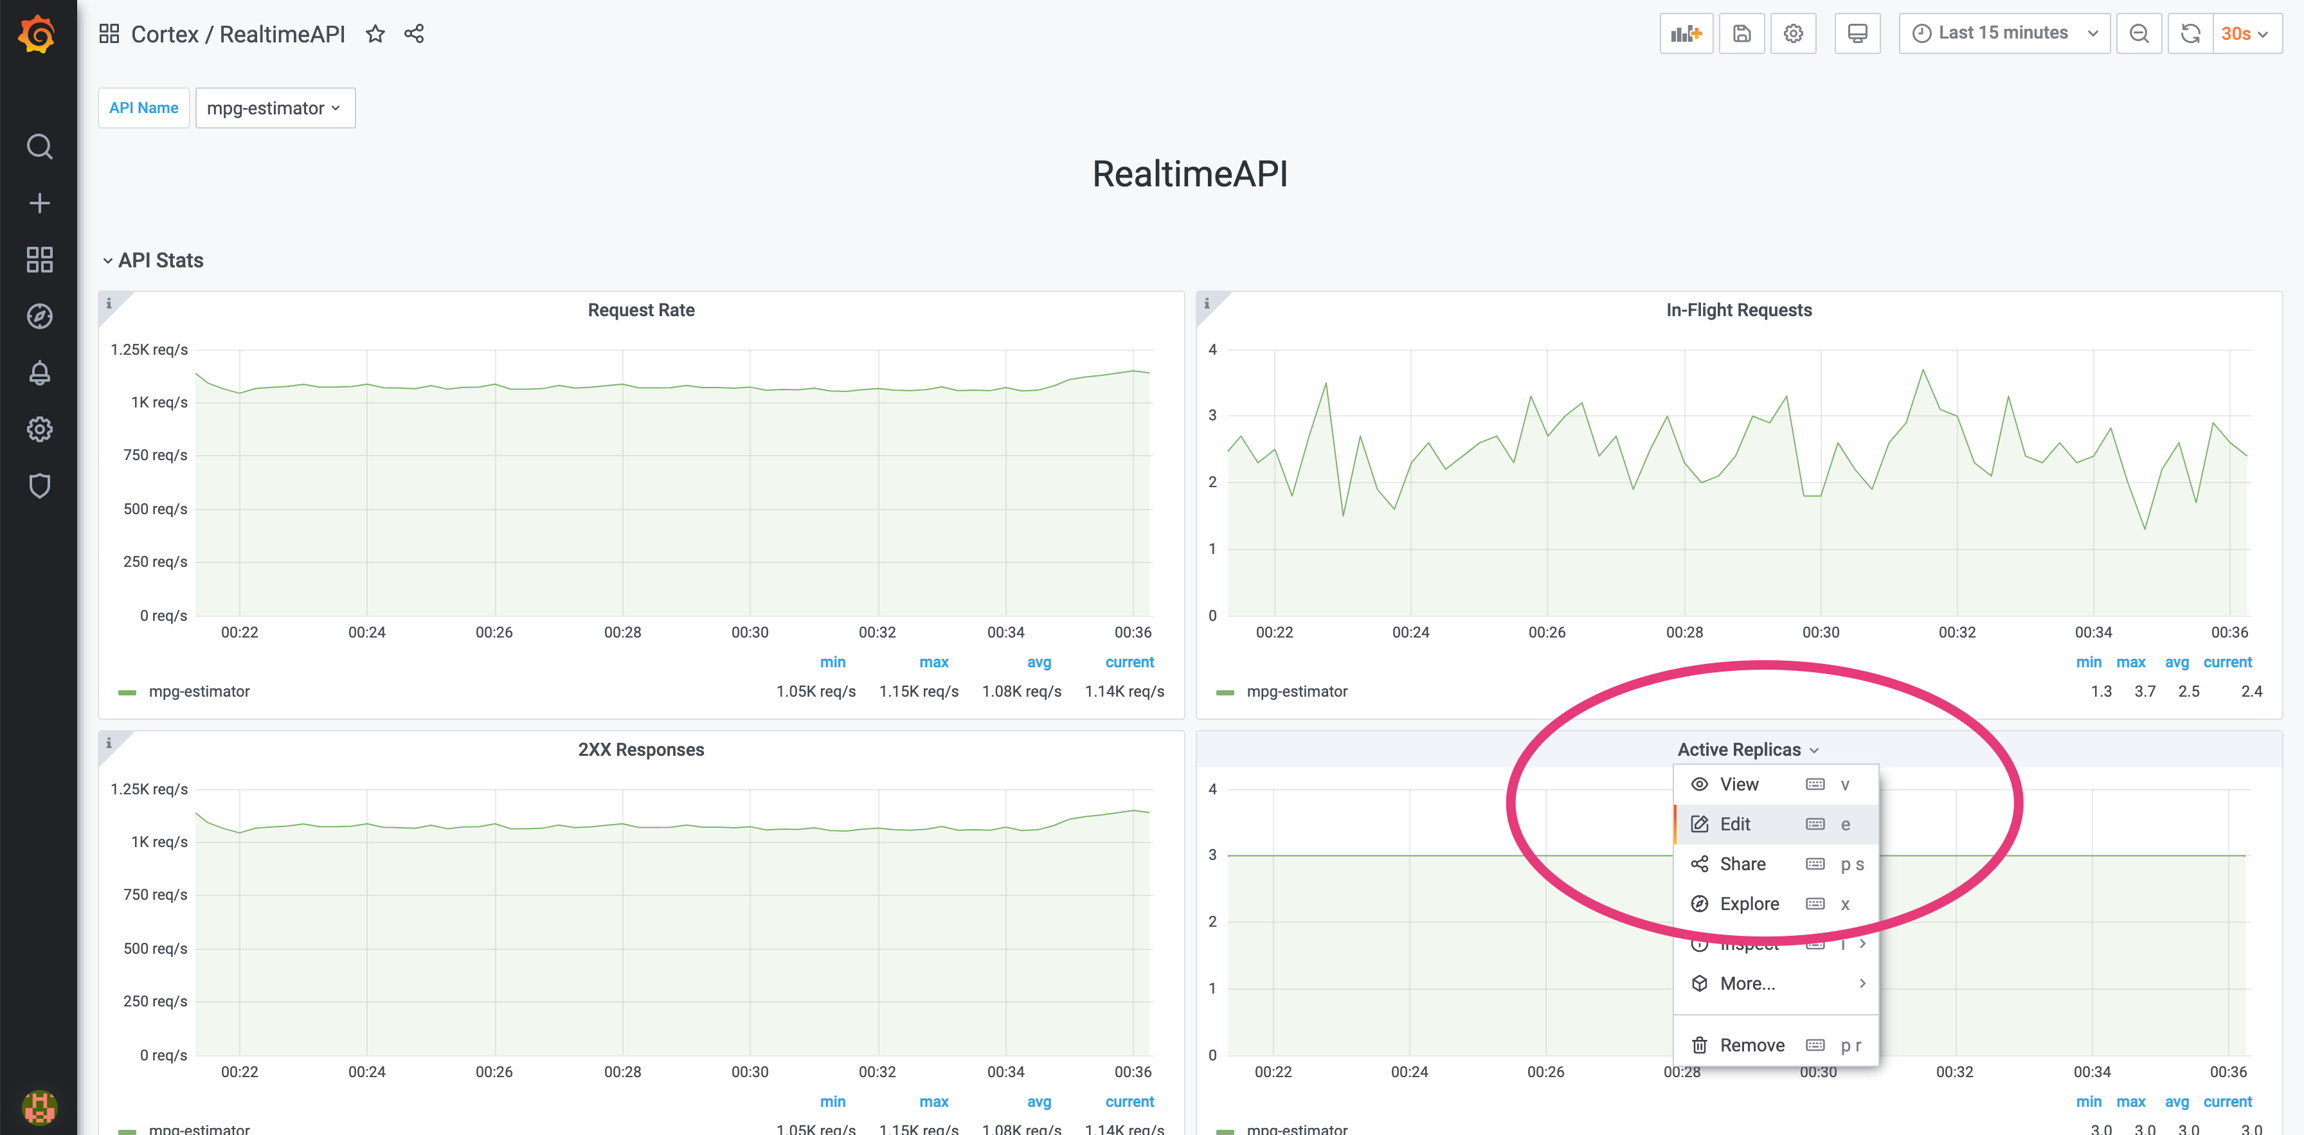
Create a copy of the primary query by clicking on the "duplicate" icon.
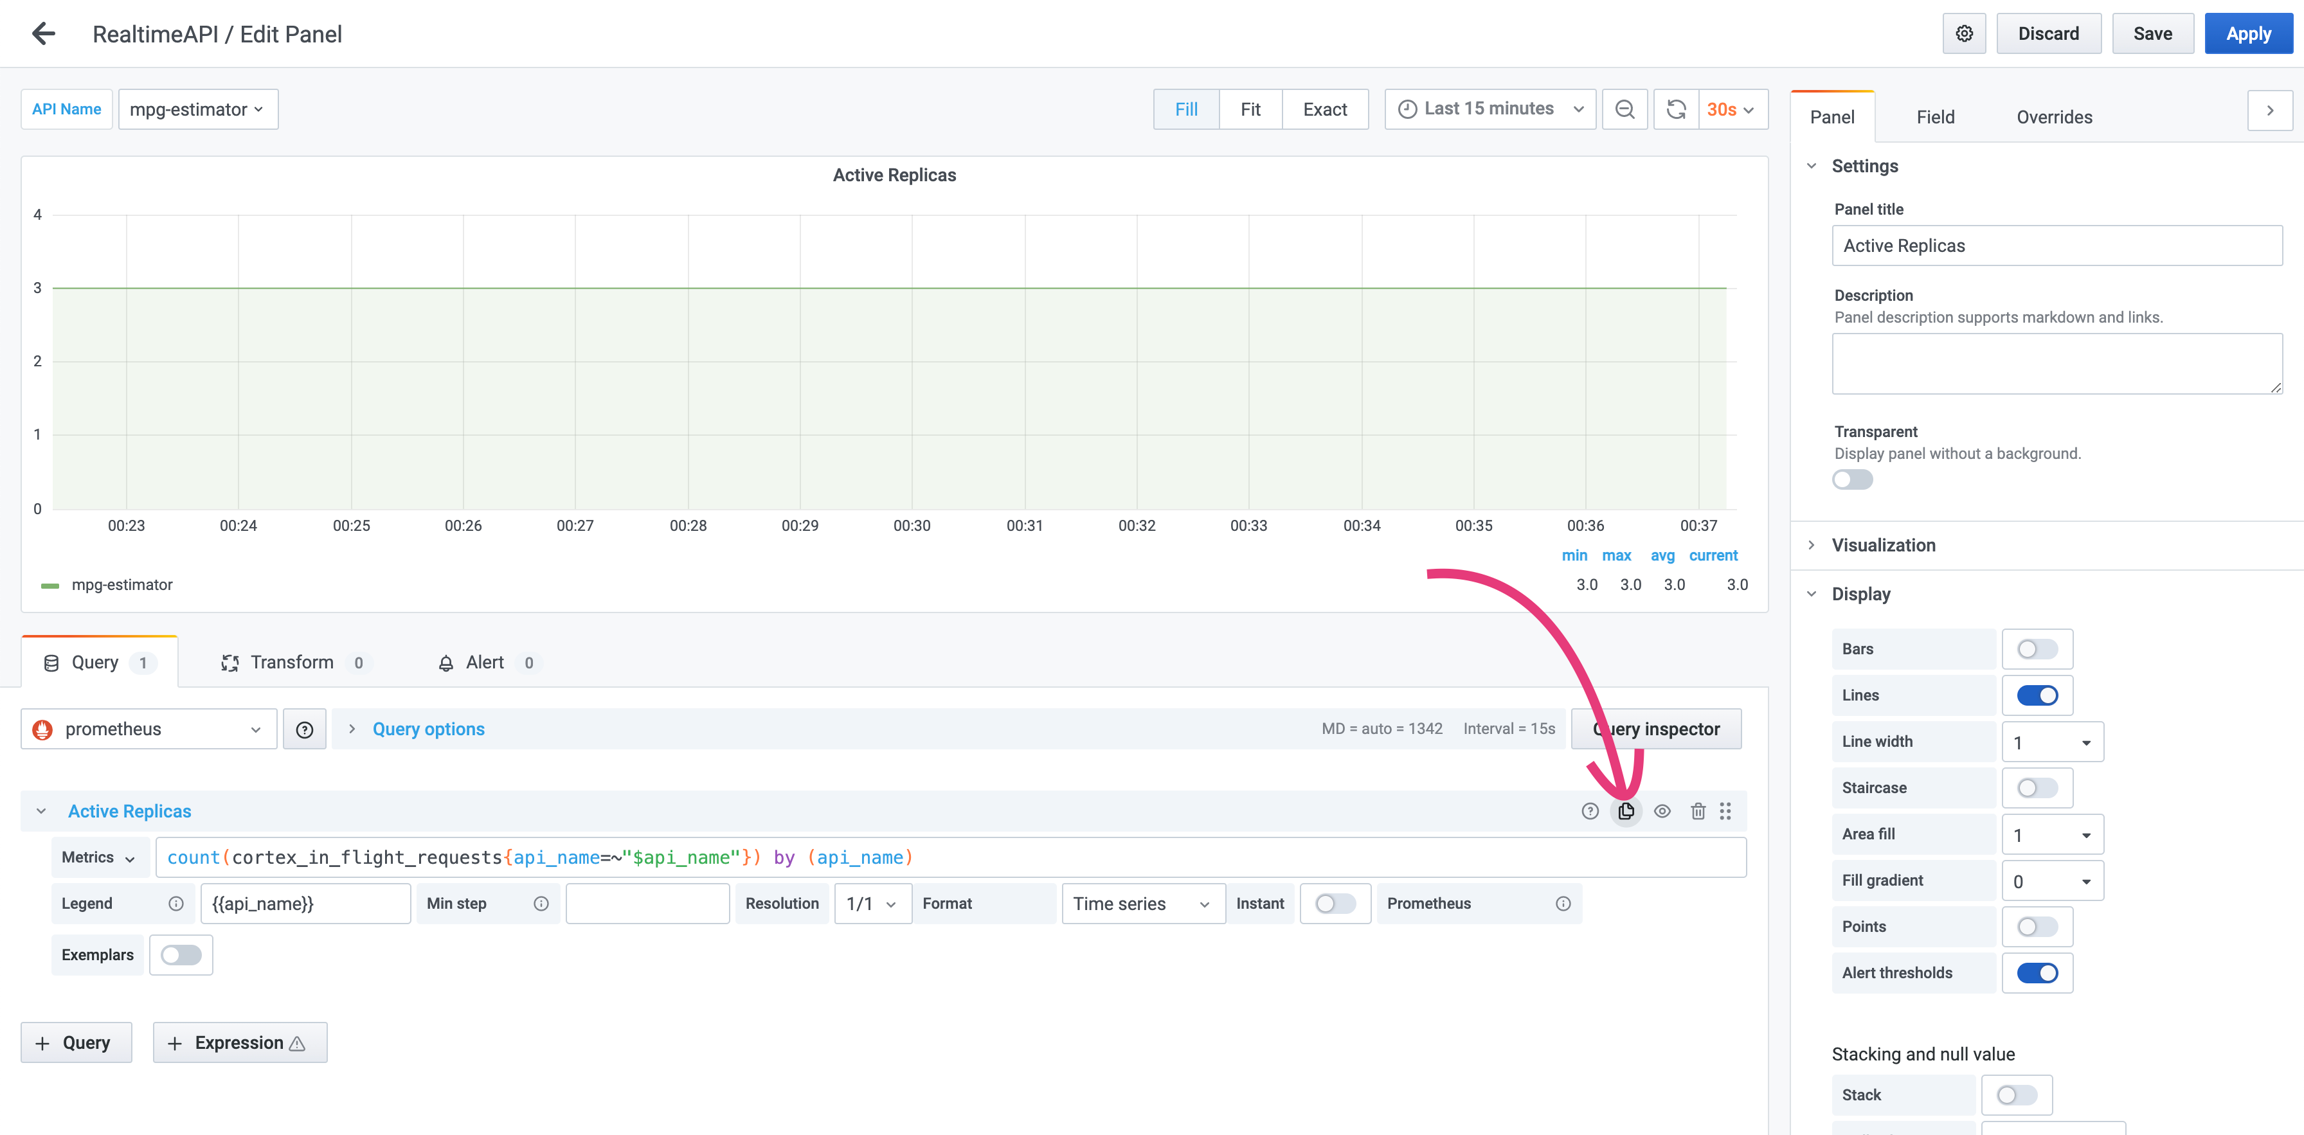
In the copied query, replace the $api_name variable with the name of the API you want to create the alert for. In our case, it's mpg-estimator. Also, click on the eye icon to disable the query from being shown on the graph - otherwise, you'll see duplicates.
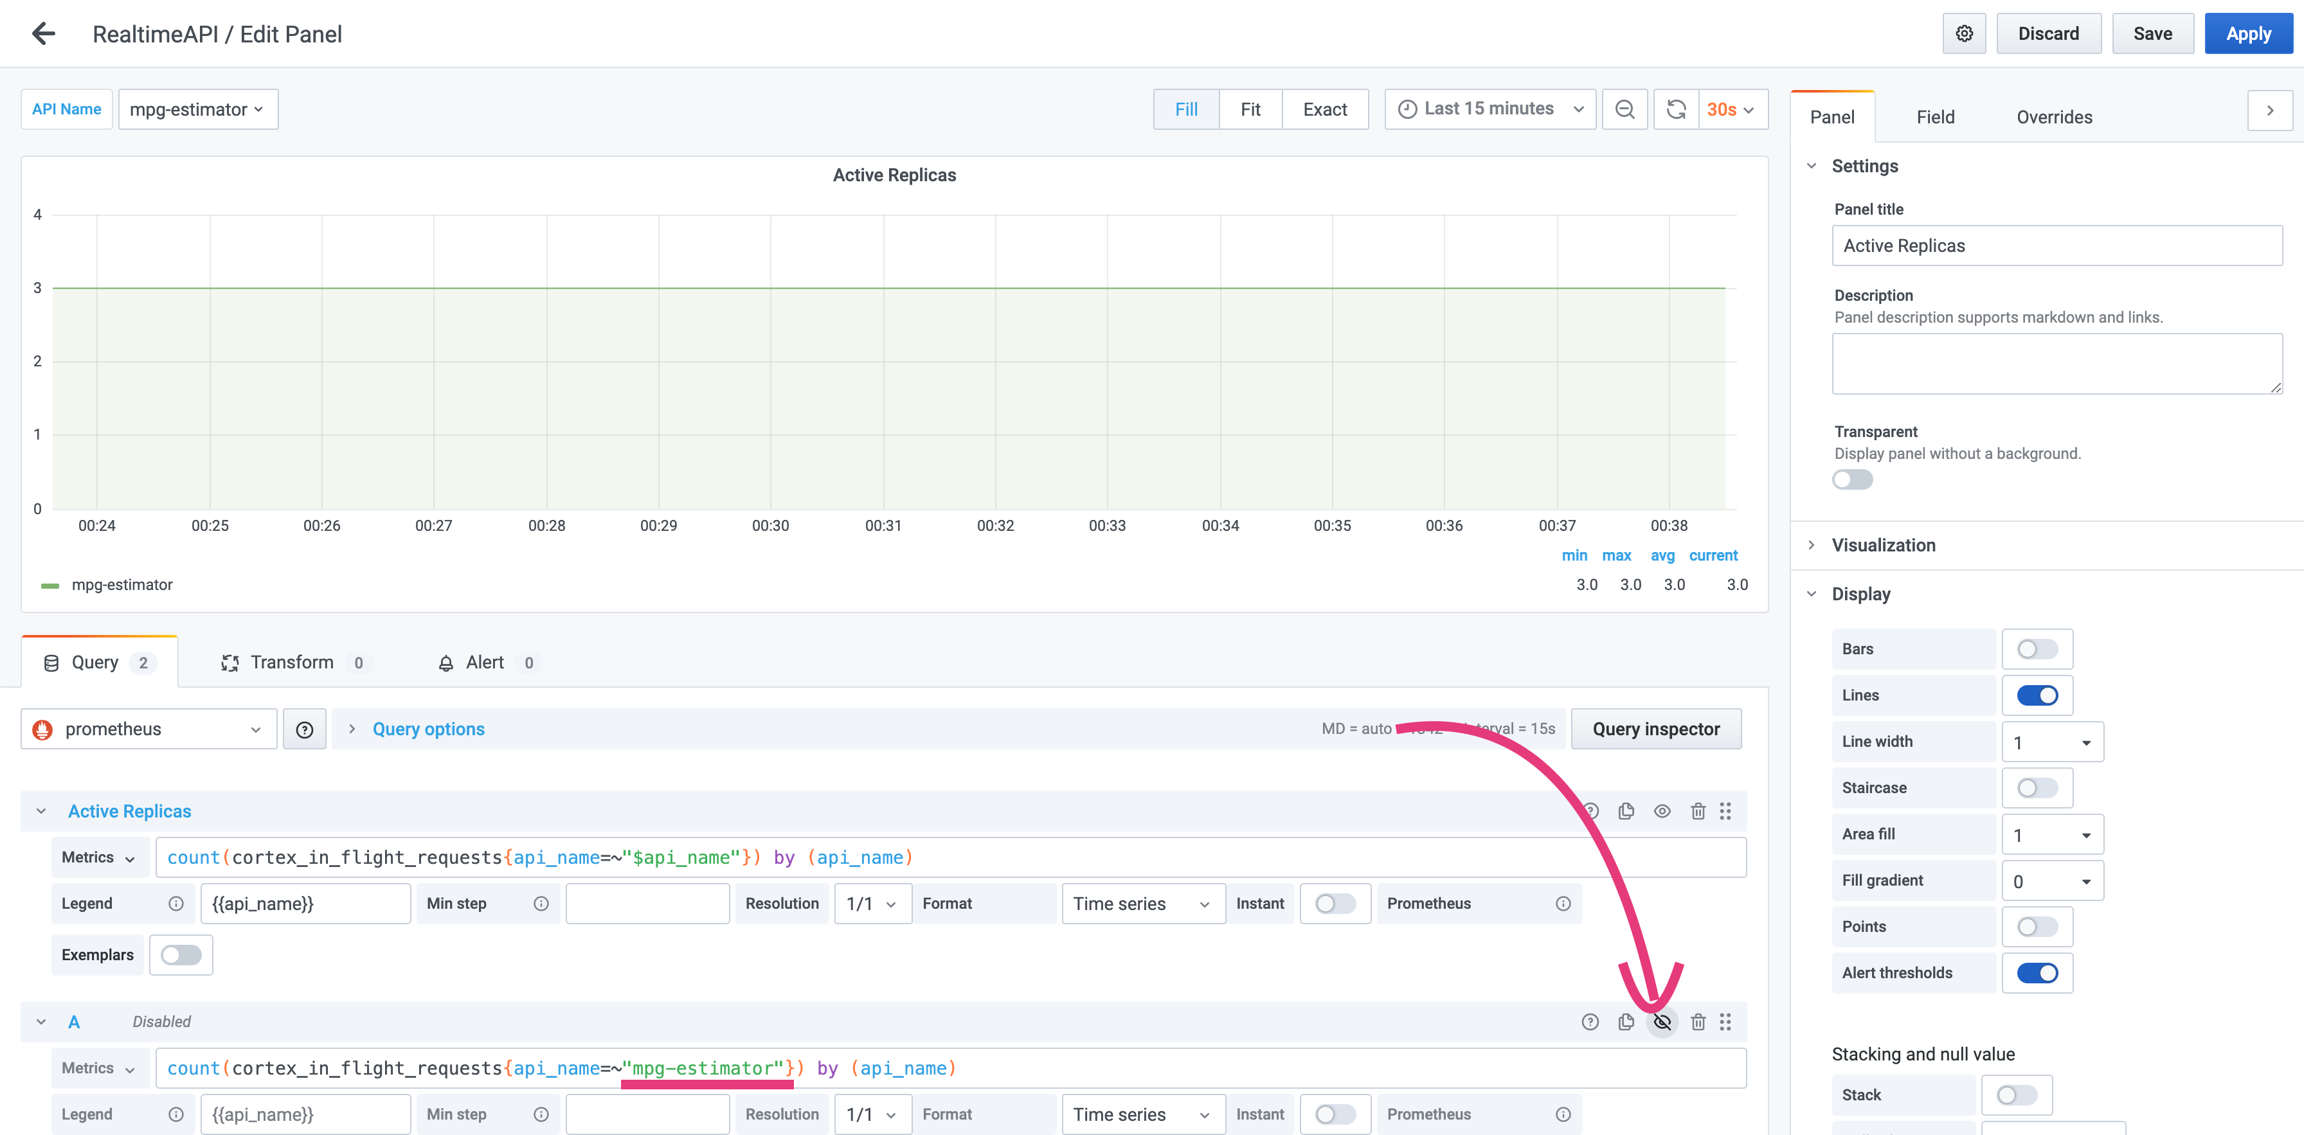
Go to the "Alert" tab and click "Create Alert".
Configure your alert like in the following example and click "Apply".
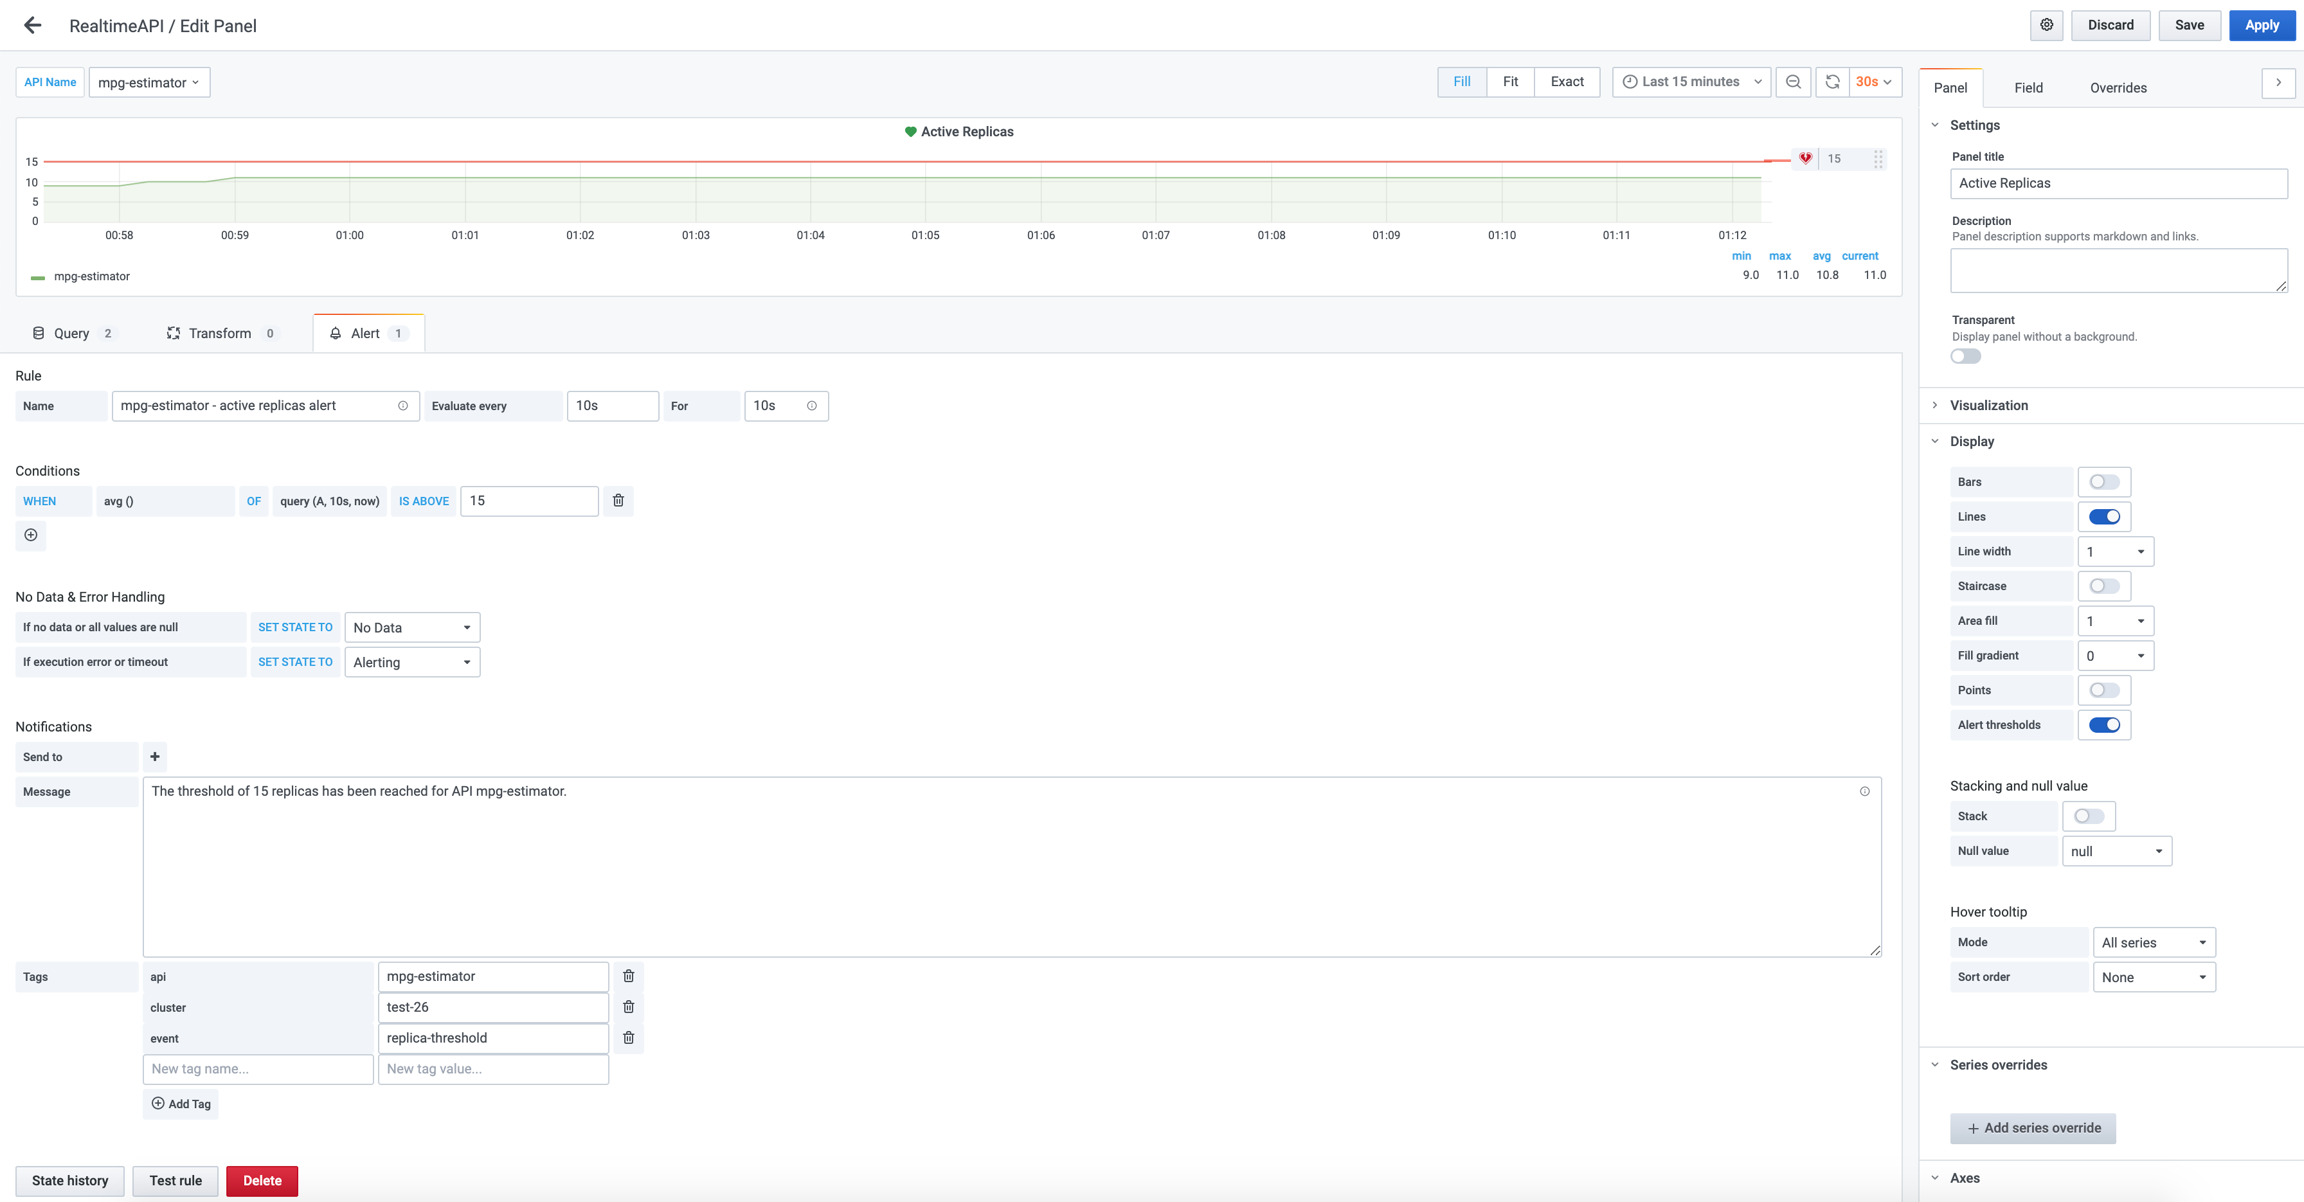
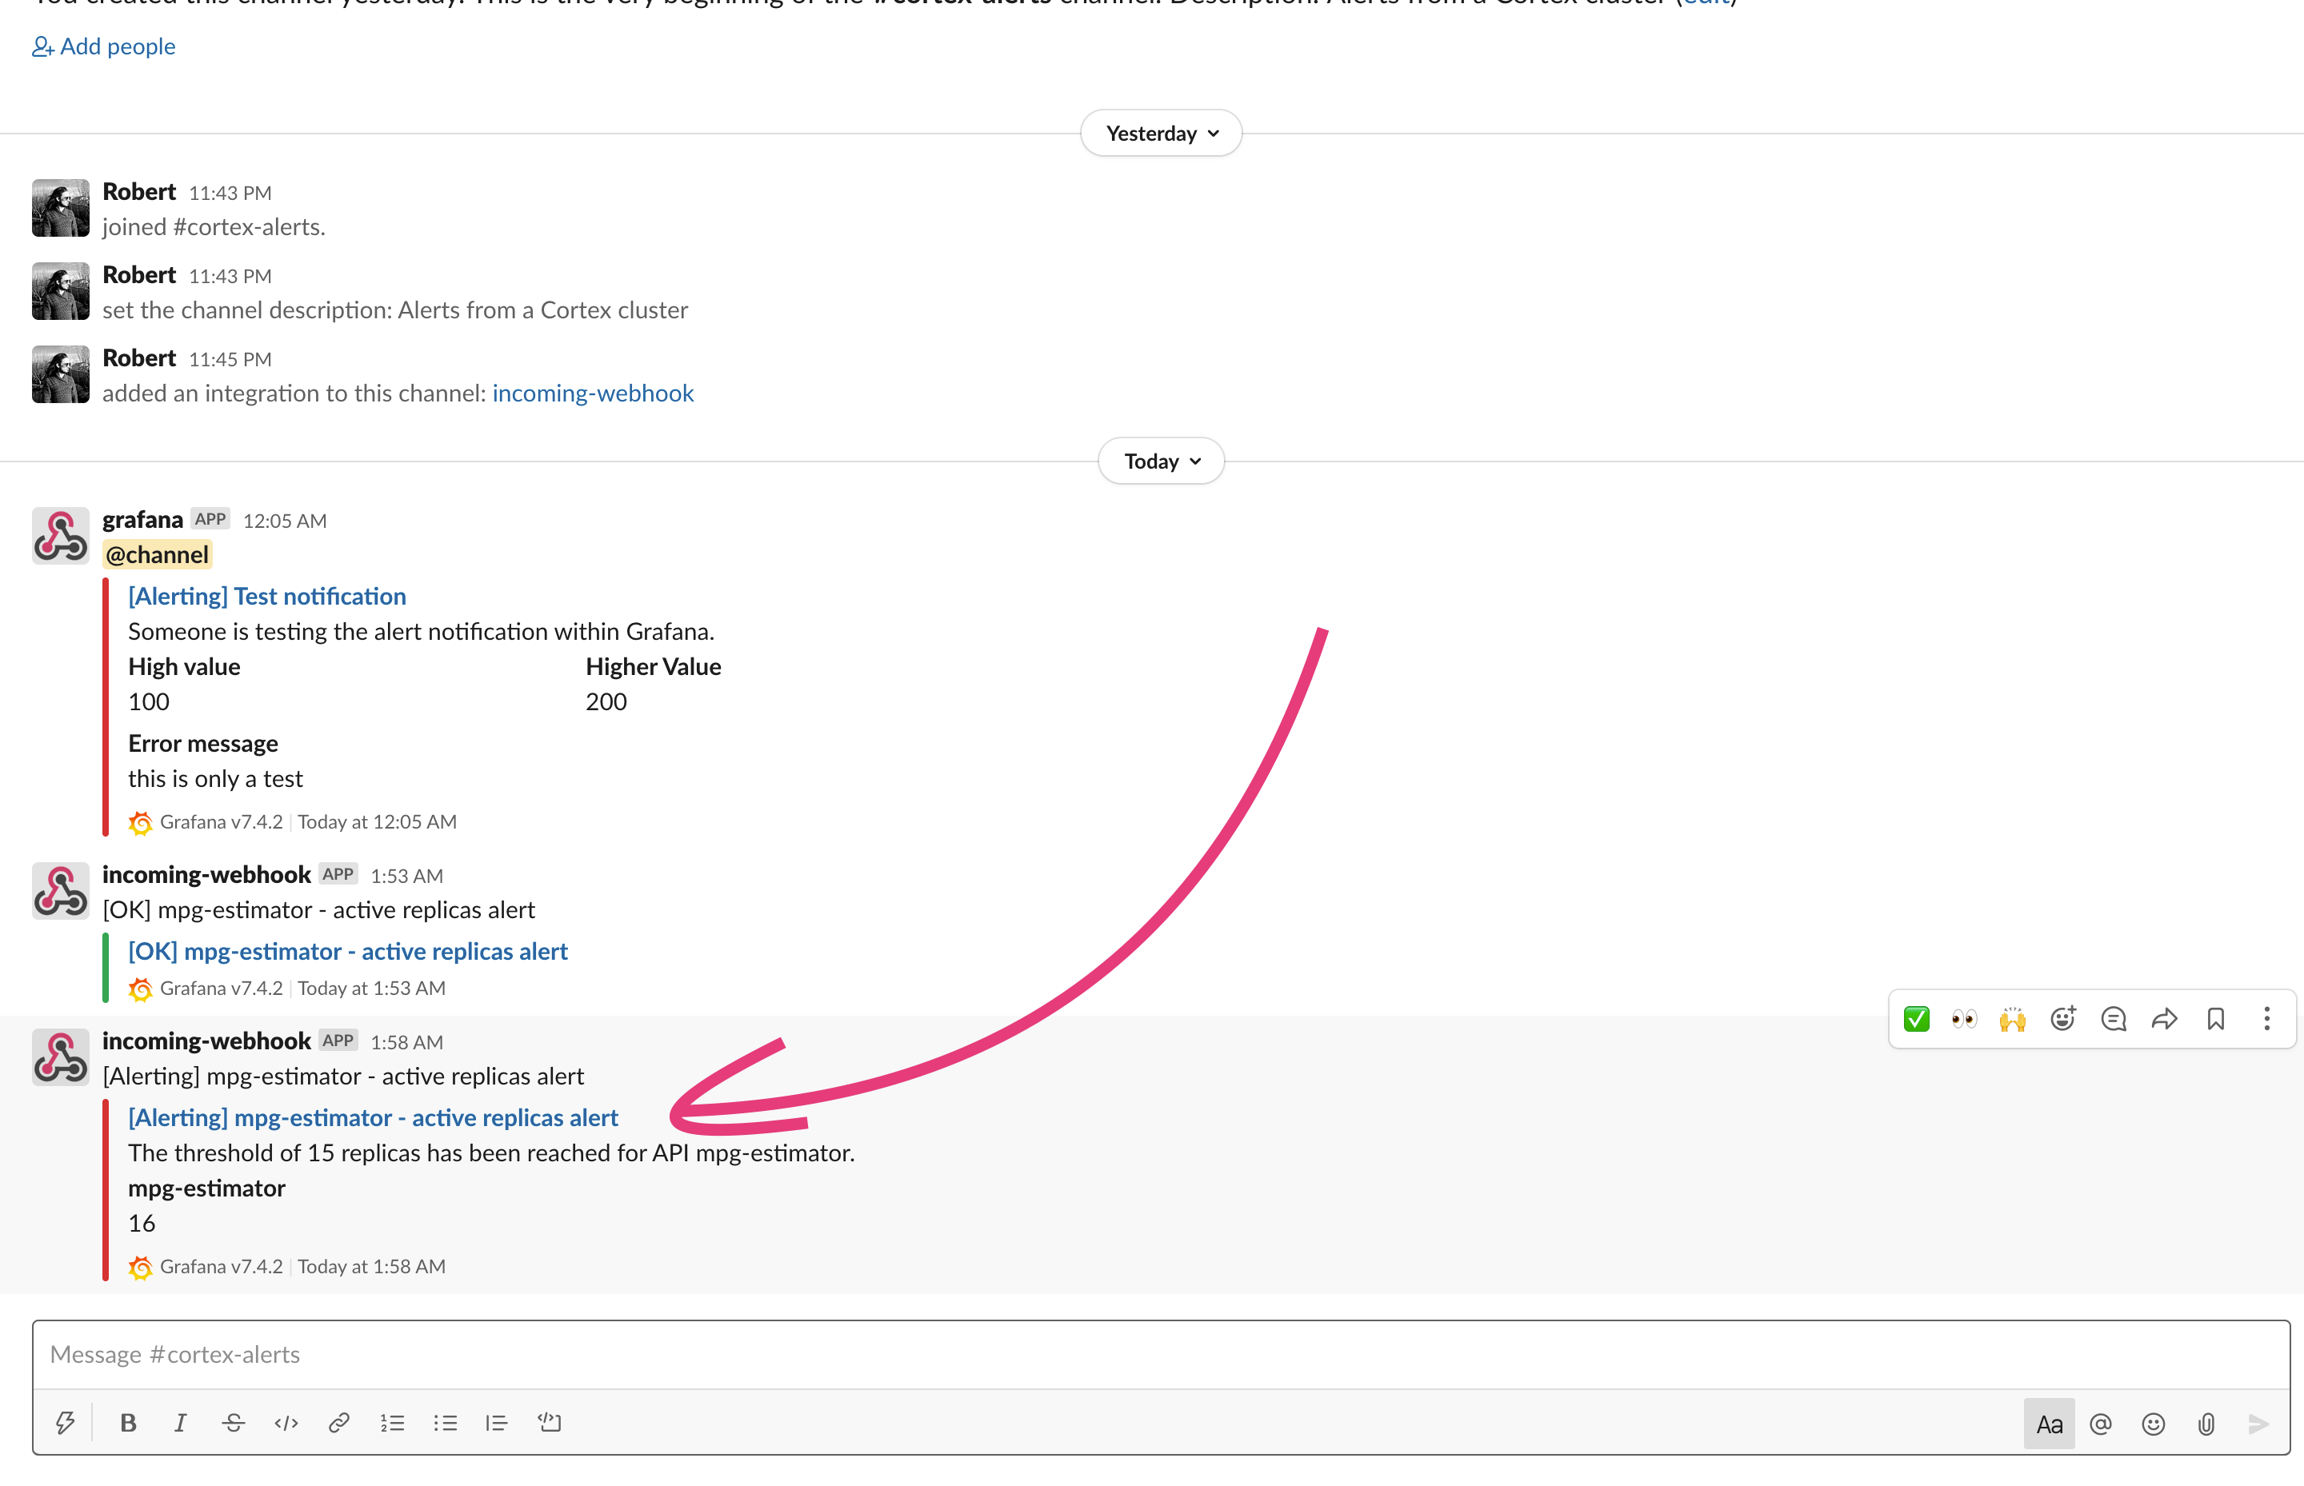
The next time the threshold is exceeded, a notification will be sent to your Slack channel.
In-flight requests spike alert
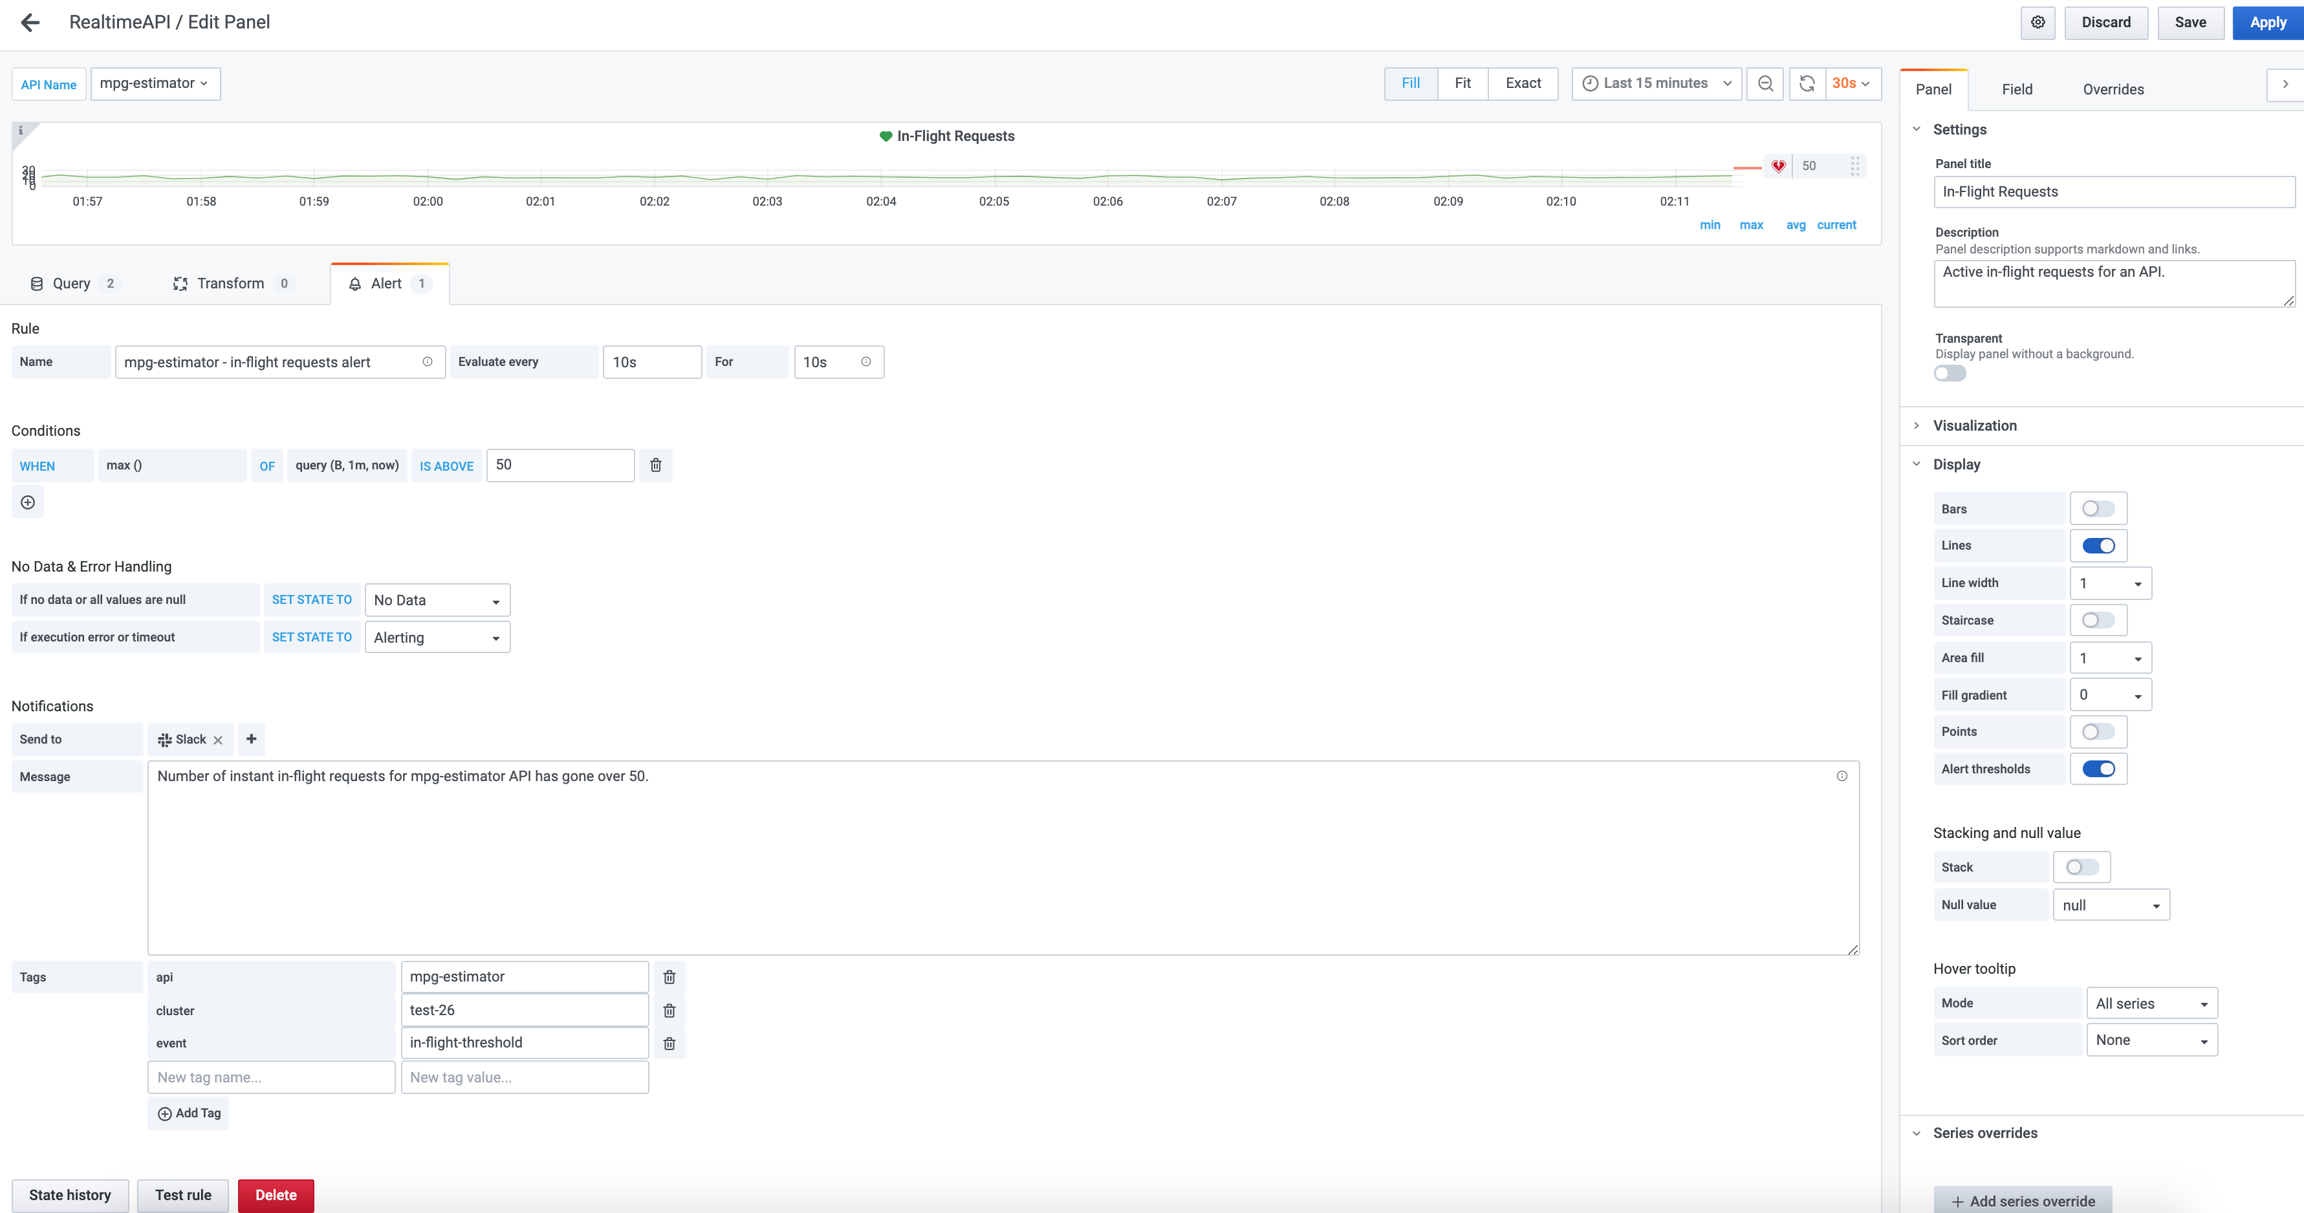
Let's add an alert on the "In-Flight Requests" panel. We want to send an alert if the metric exceeds 50 in-flight requests. For this, follow the same set of instructions as for the previous alert, but this time configure the alert to match the following screenshot:
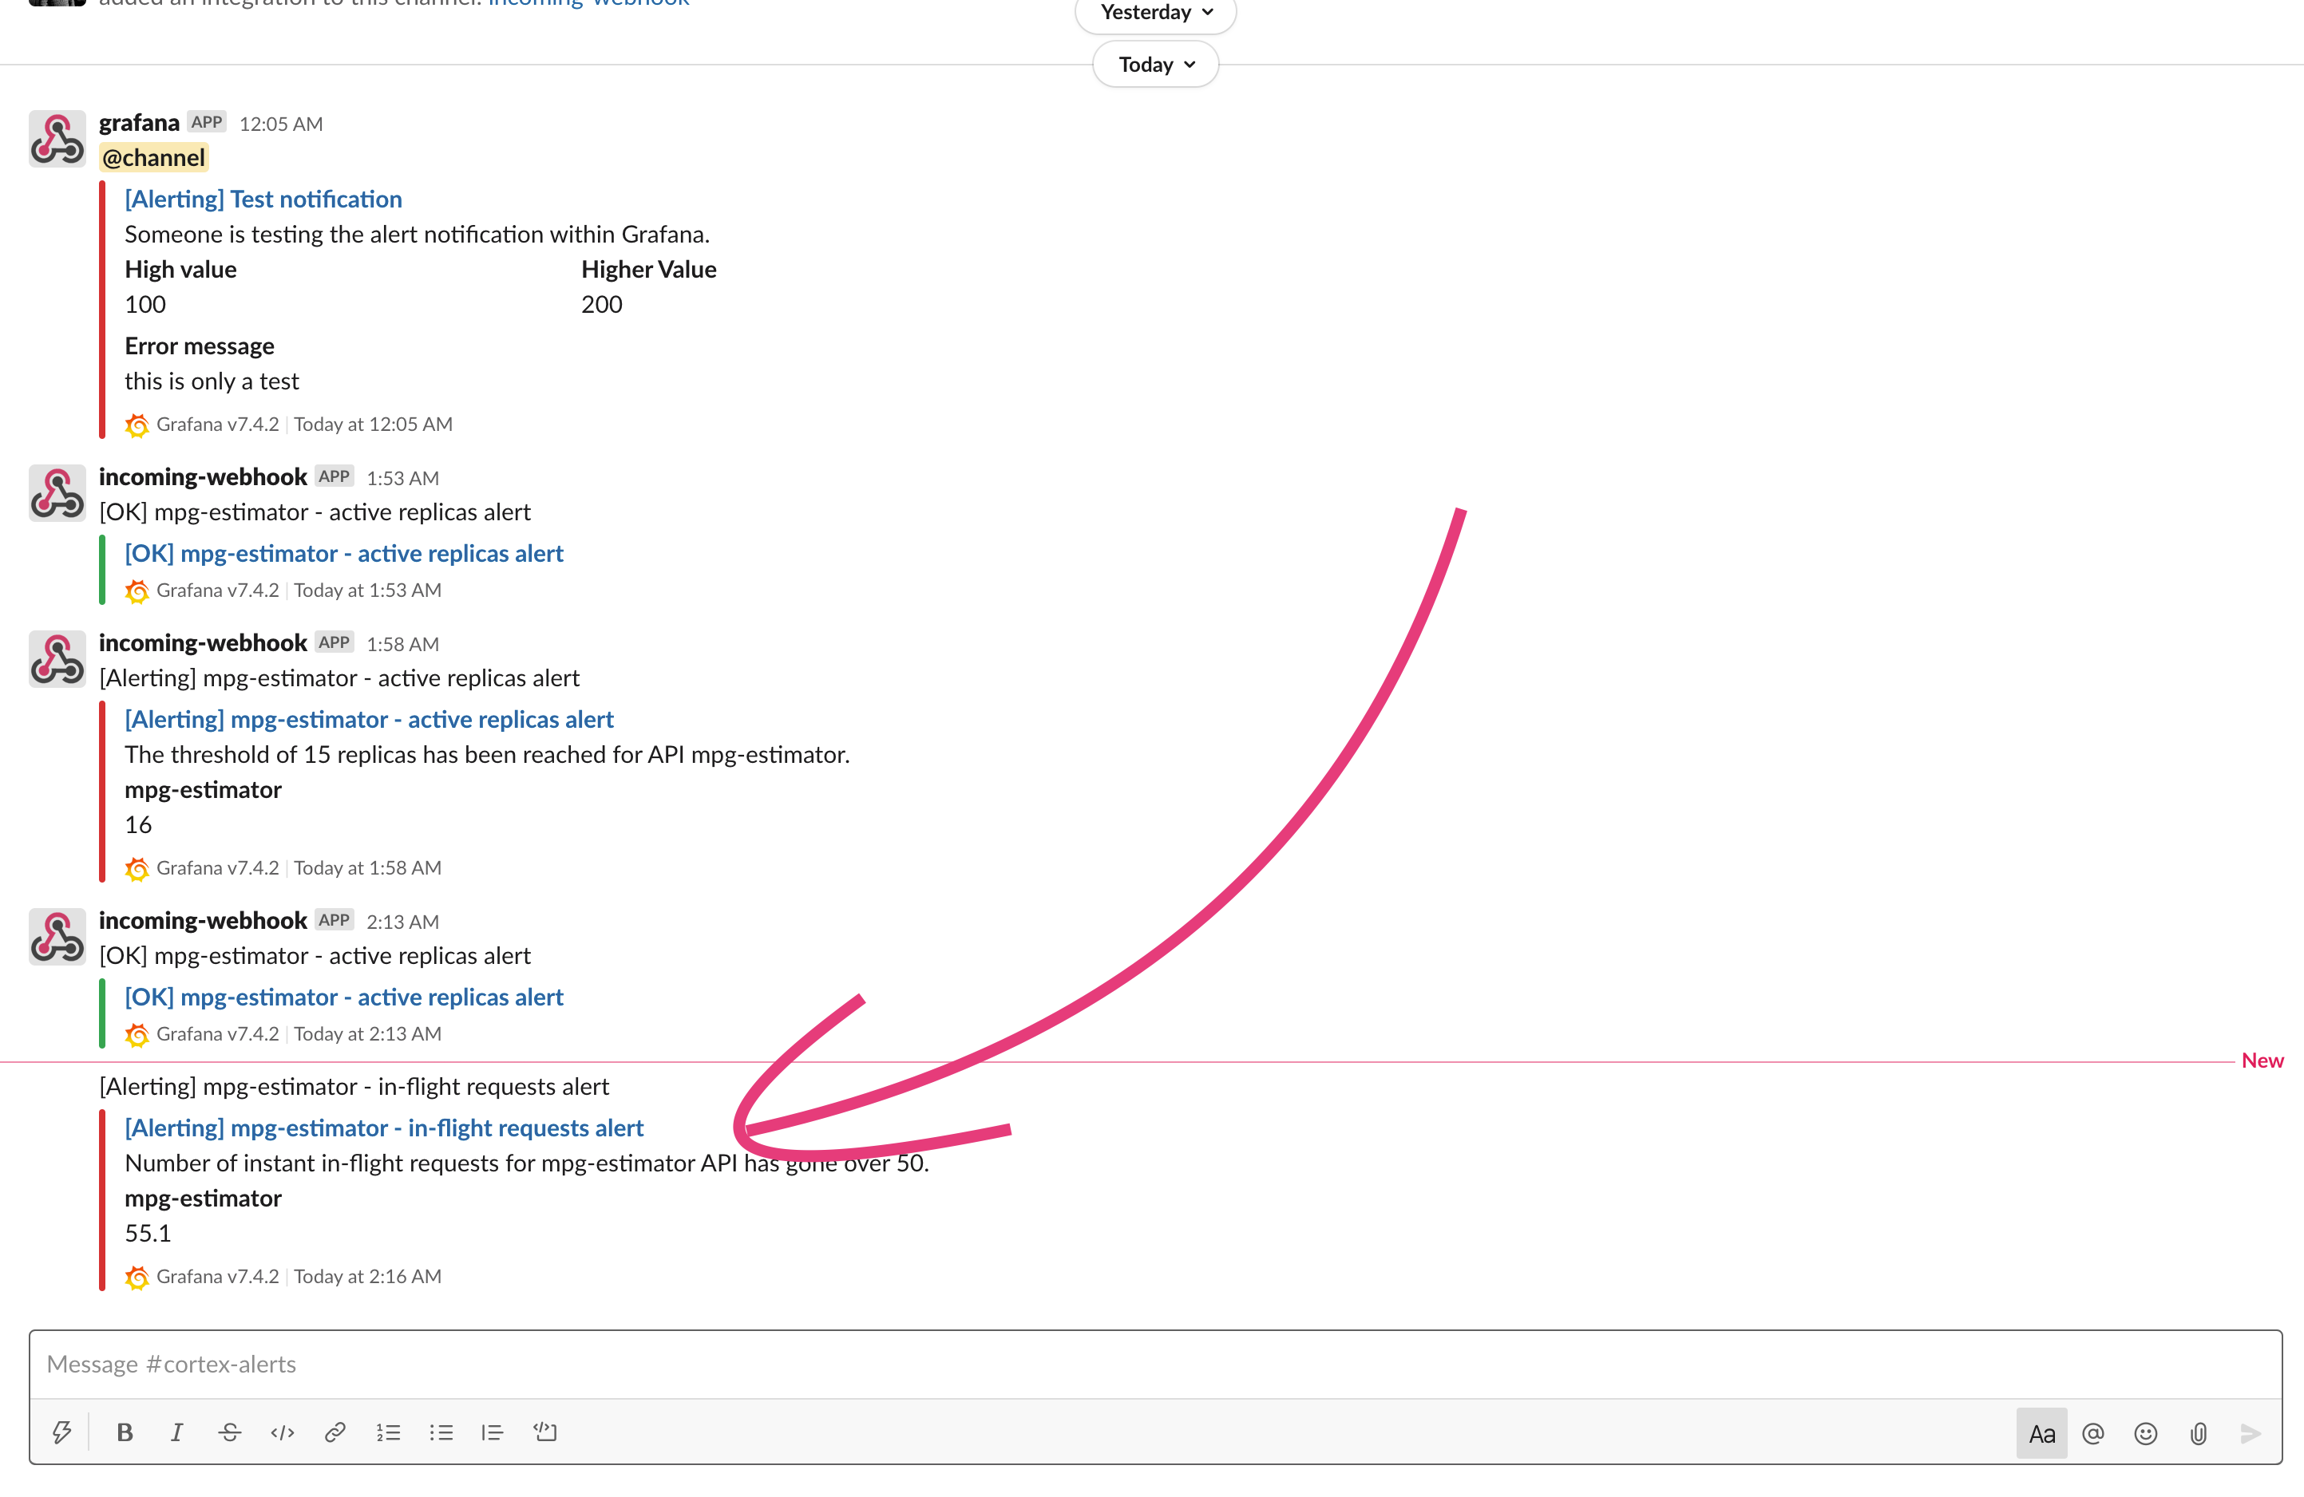
An alert triggered for this will look like:
Memory usage alert
Let's add another alert, this time for the "Avg Memory Usage" panel. We want to send an alert if the average memory usage per API replica exceeds its memory request. For this, we need to follow the same set of instructions as for the first alert, but this time the hidden query needs to be expressed as the ratio between the memory usage and memory request:
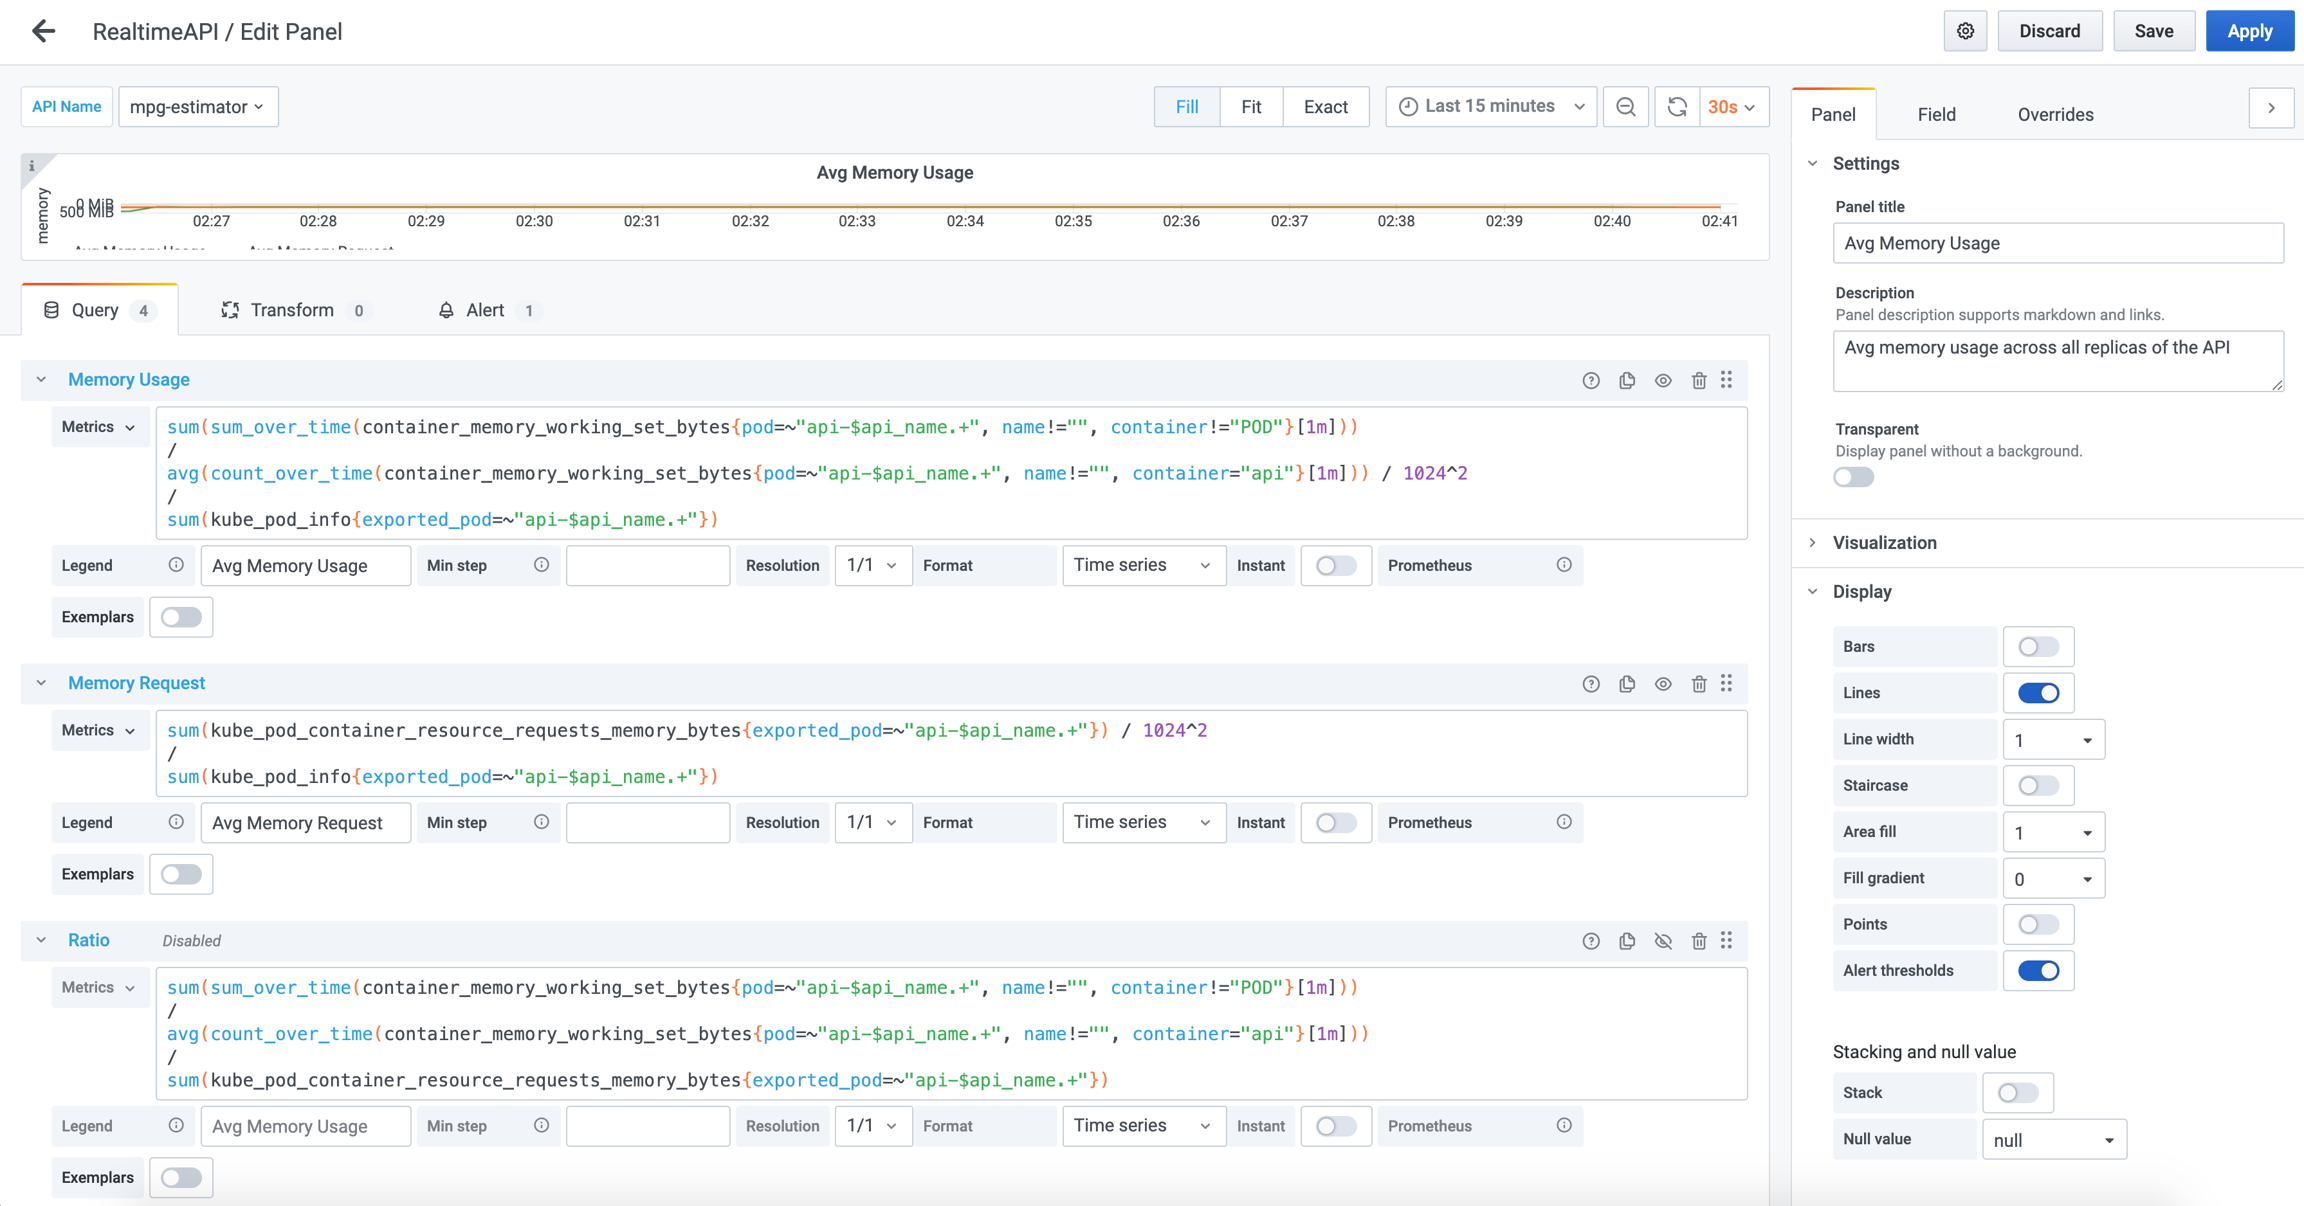
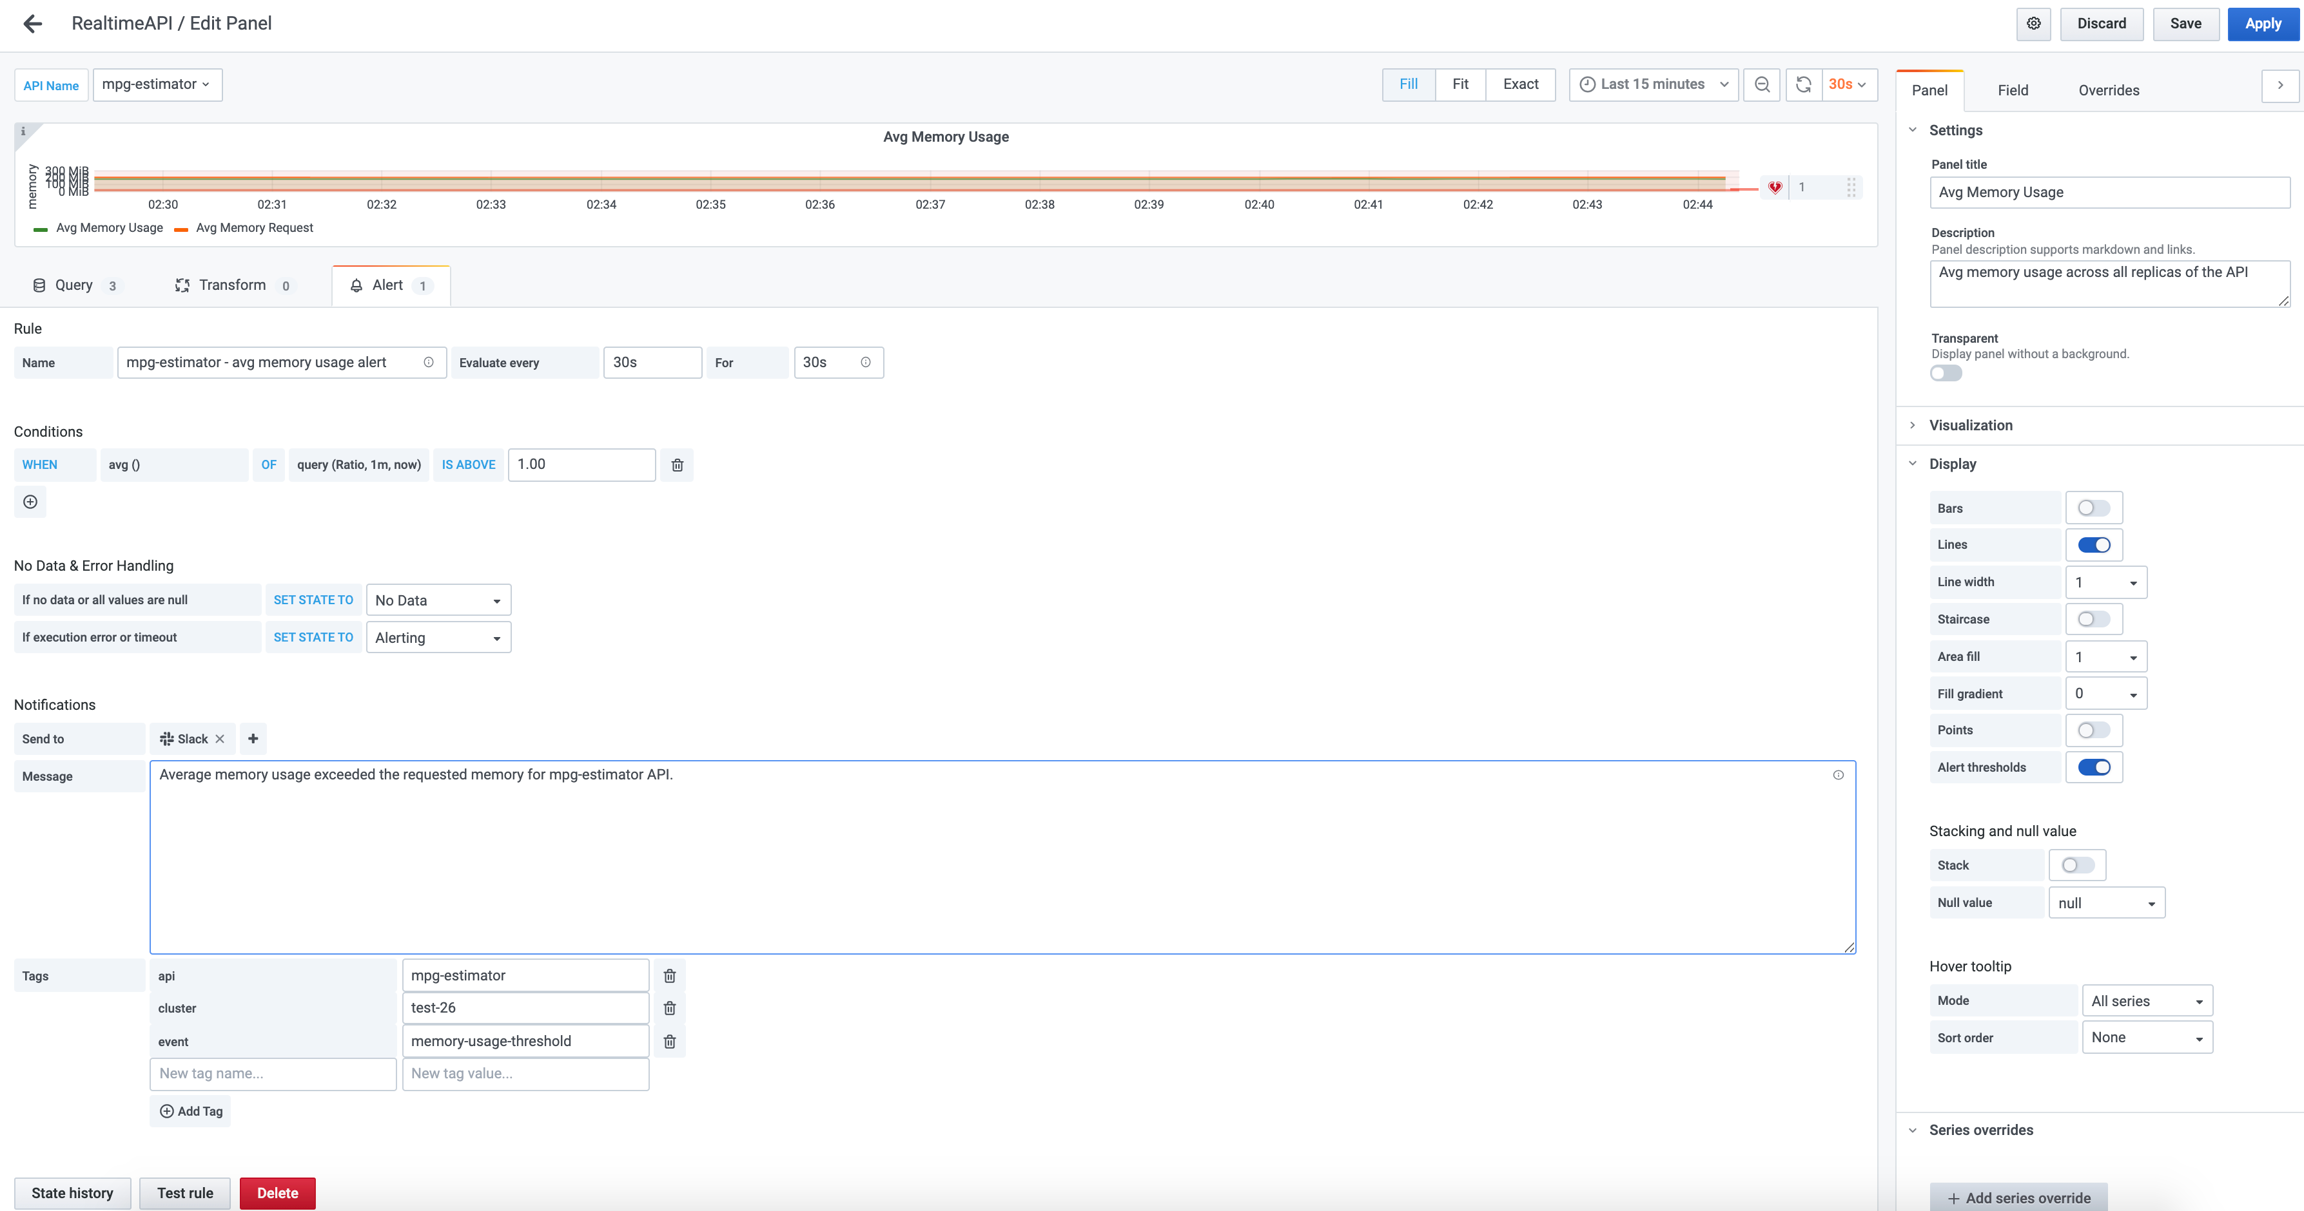
The memory usage alert can to be defined like in the following screenshot:
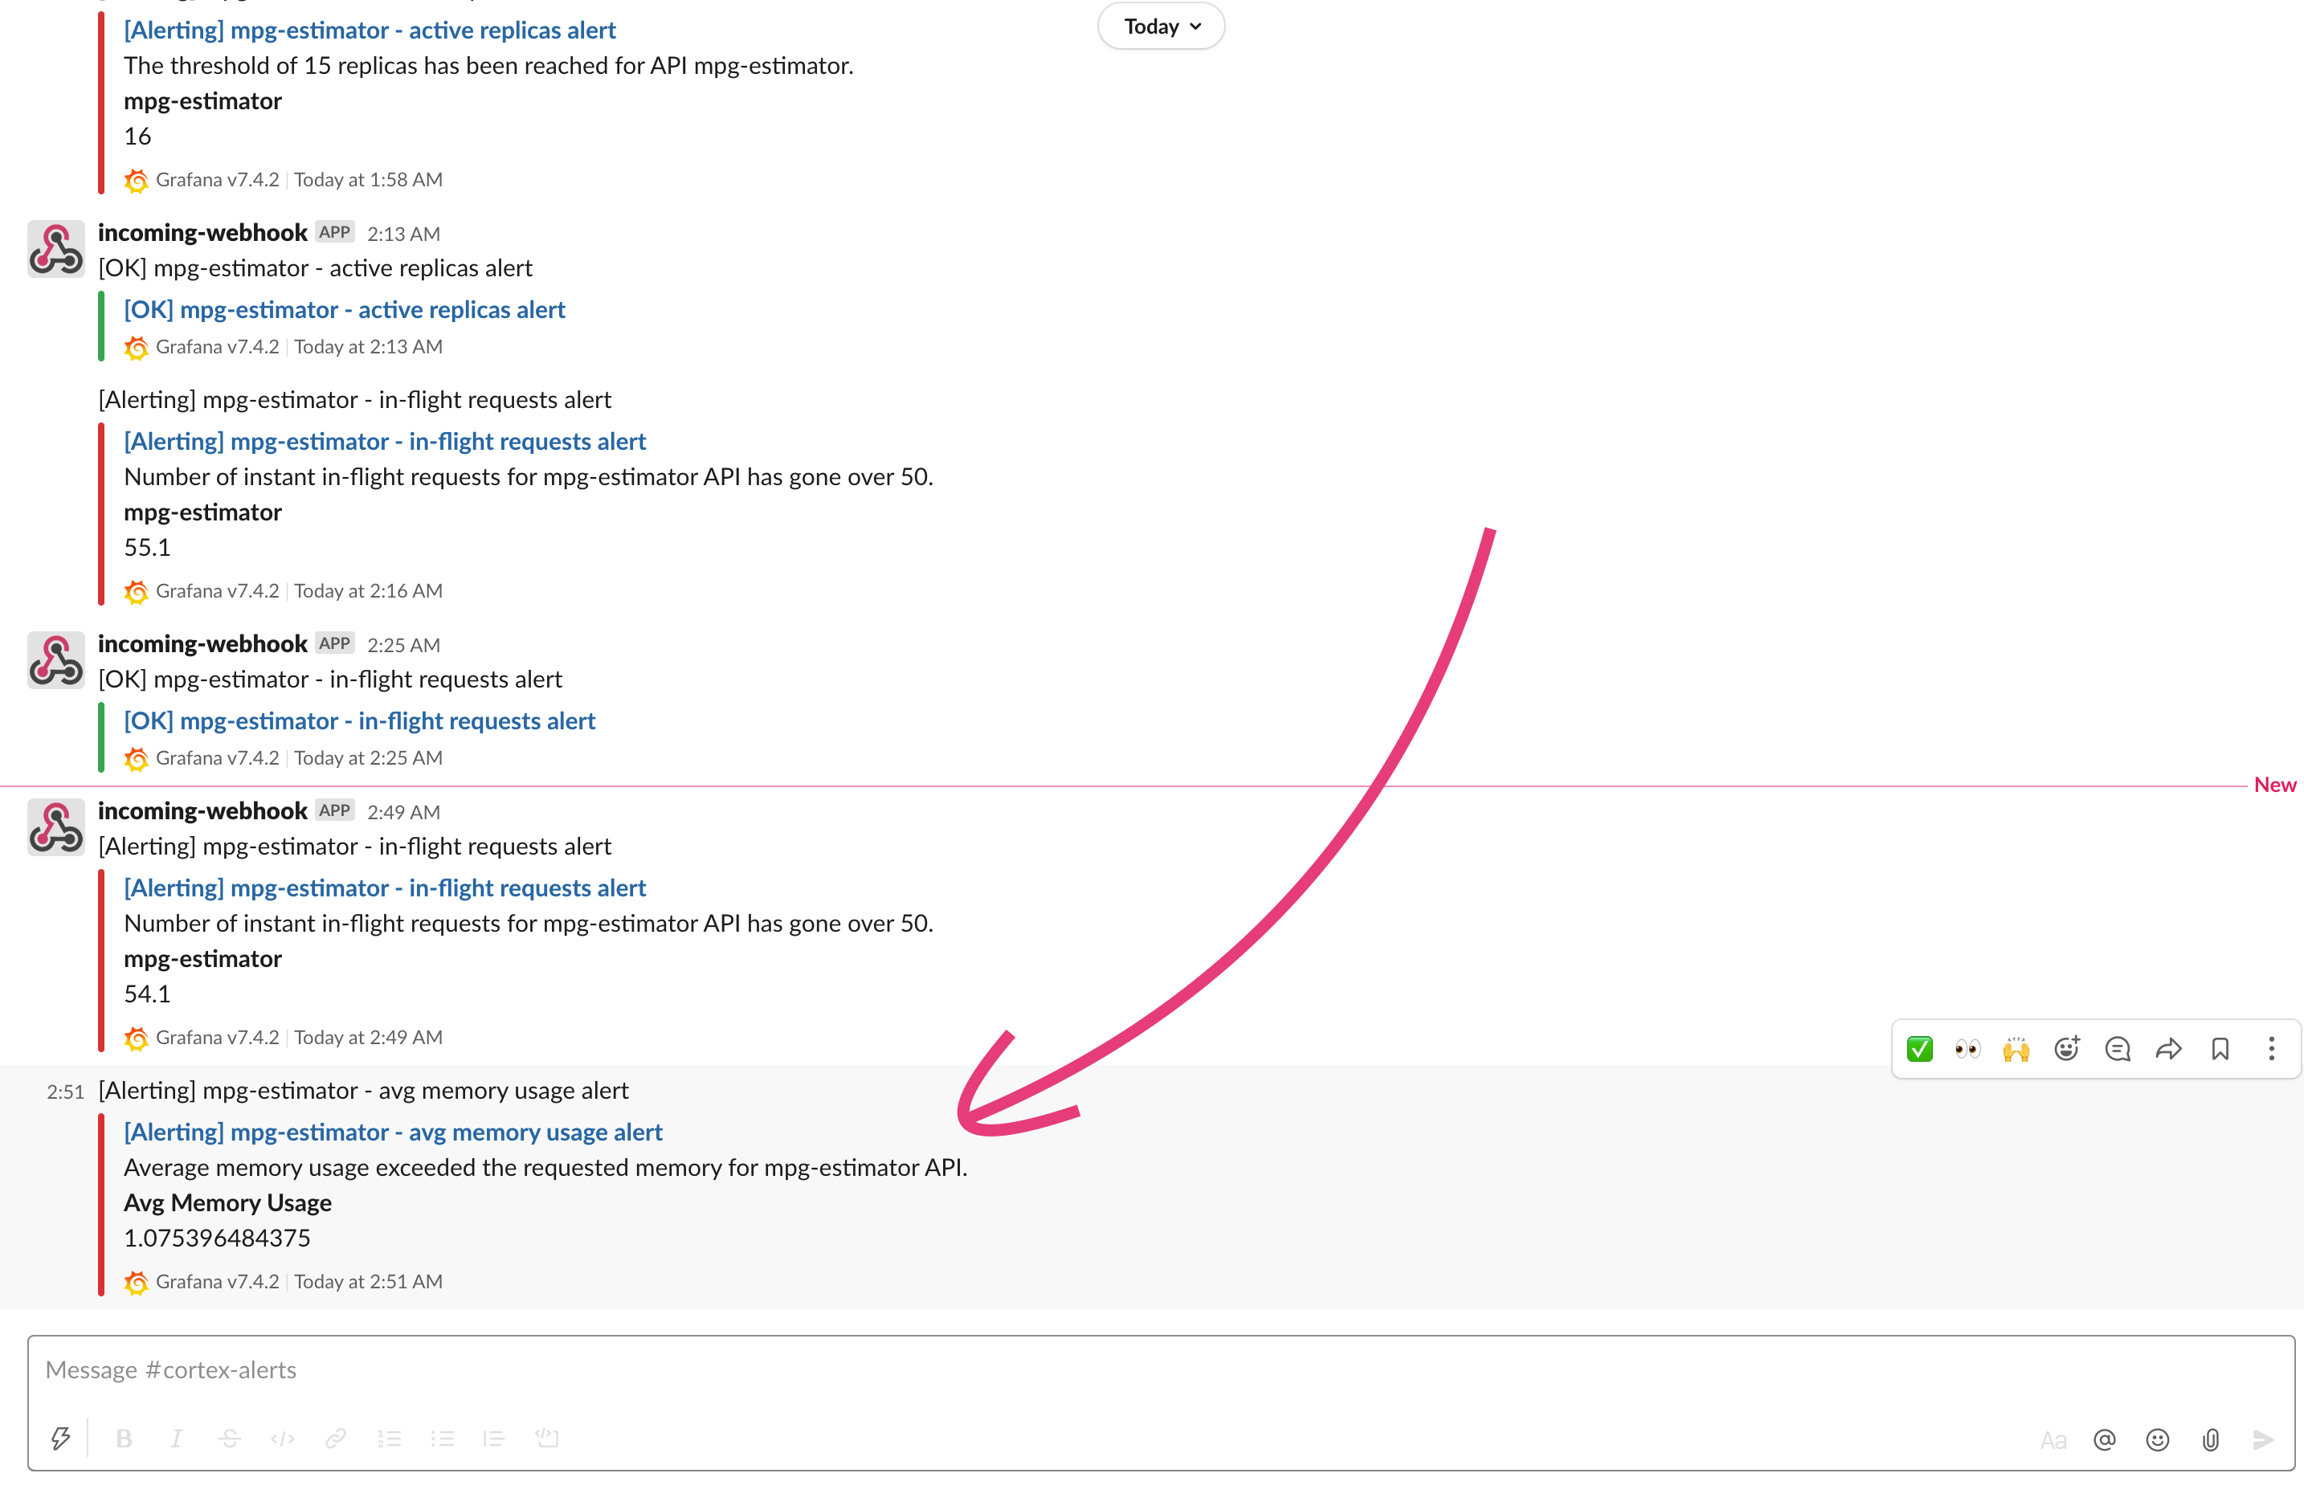
The resulting alert will look like this:
Persistent changes
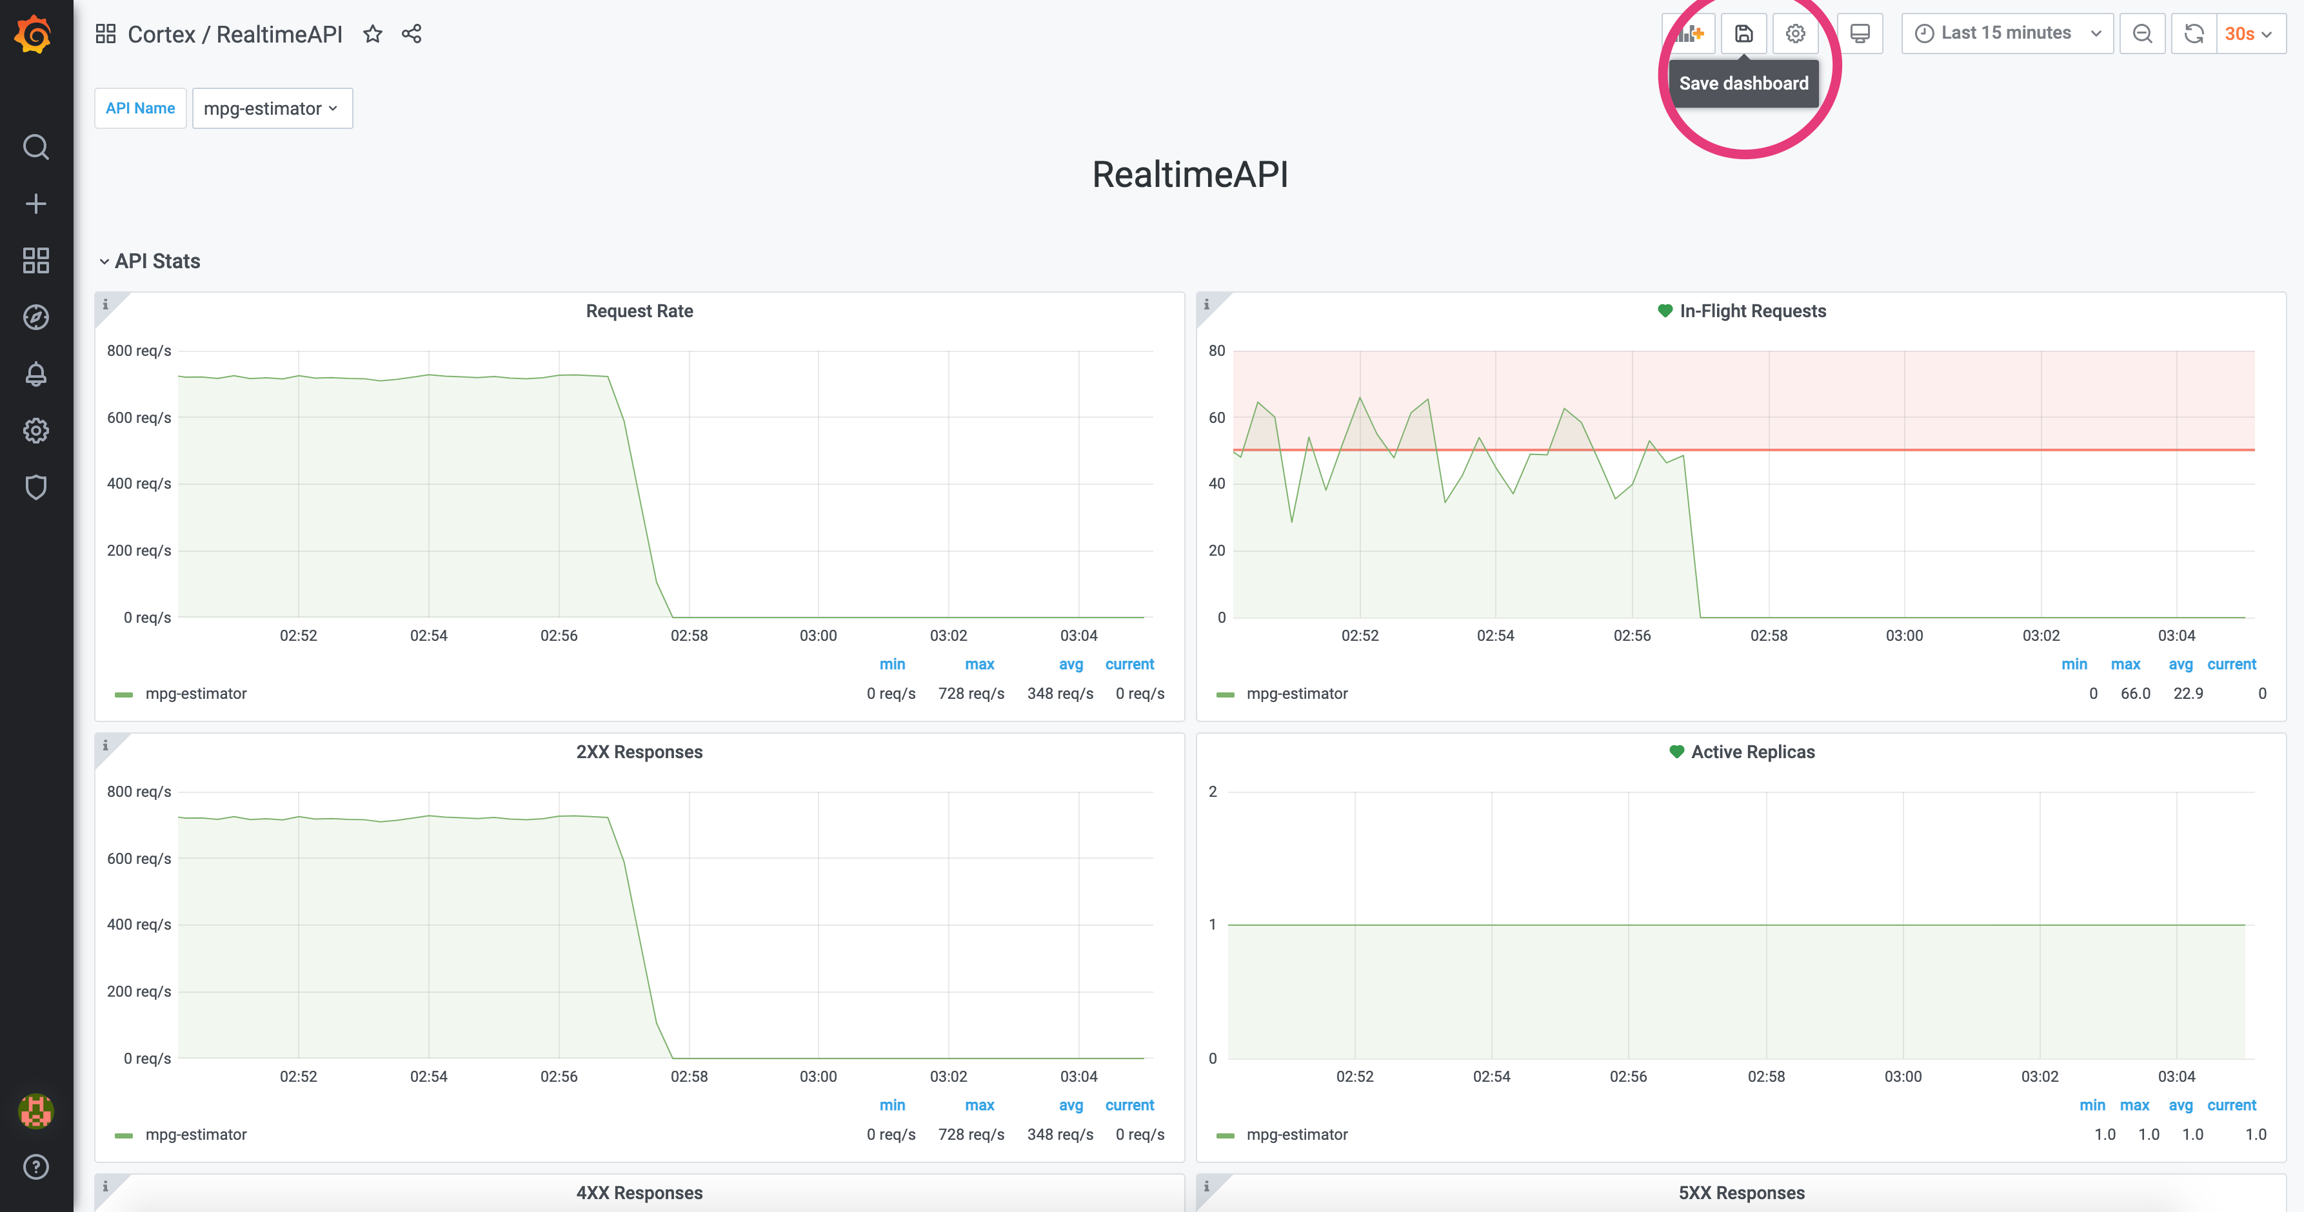
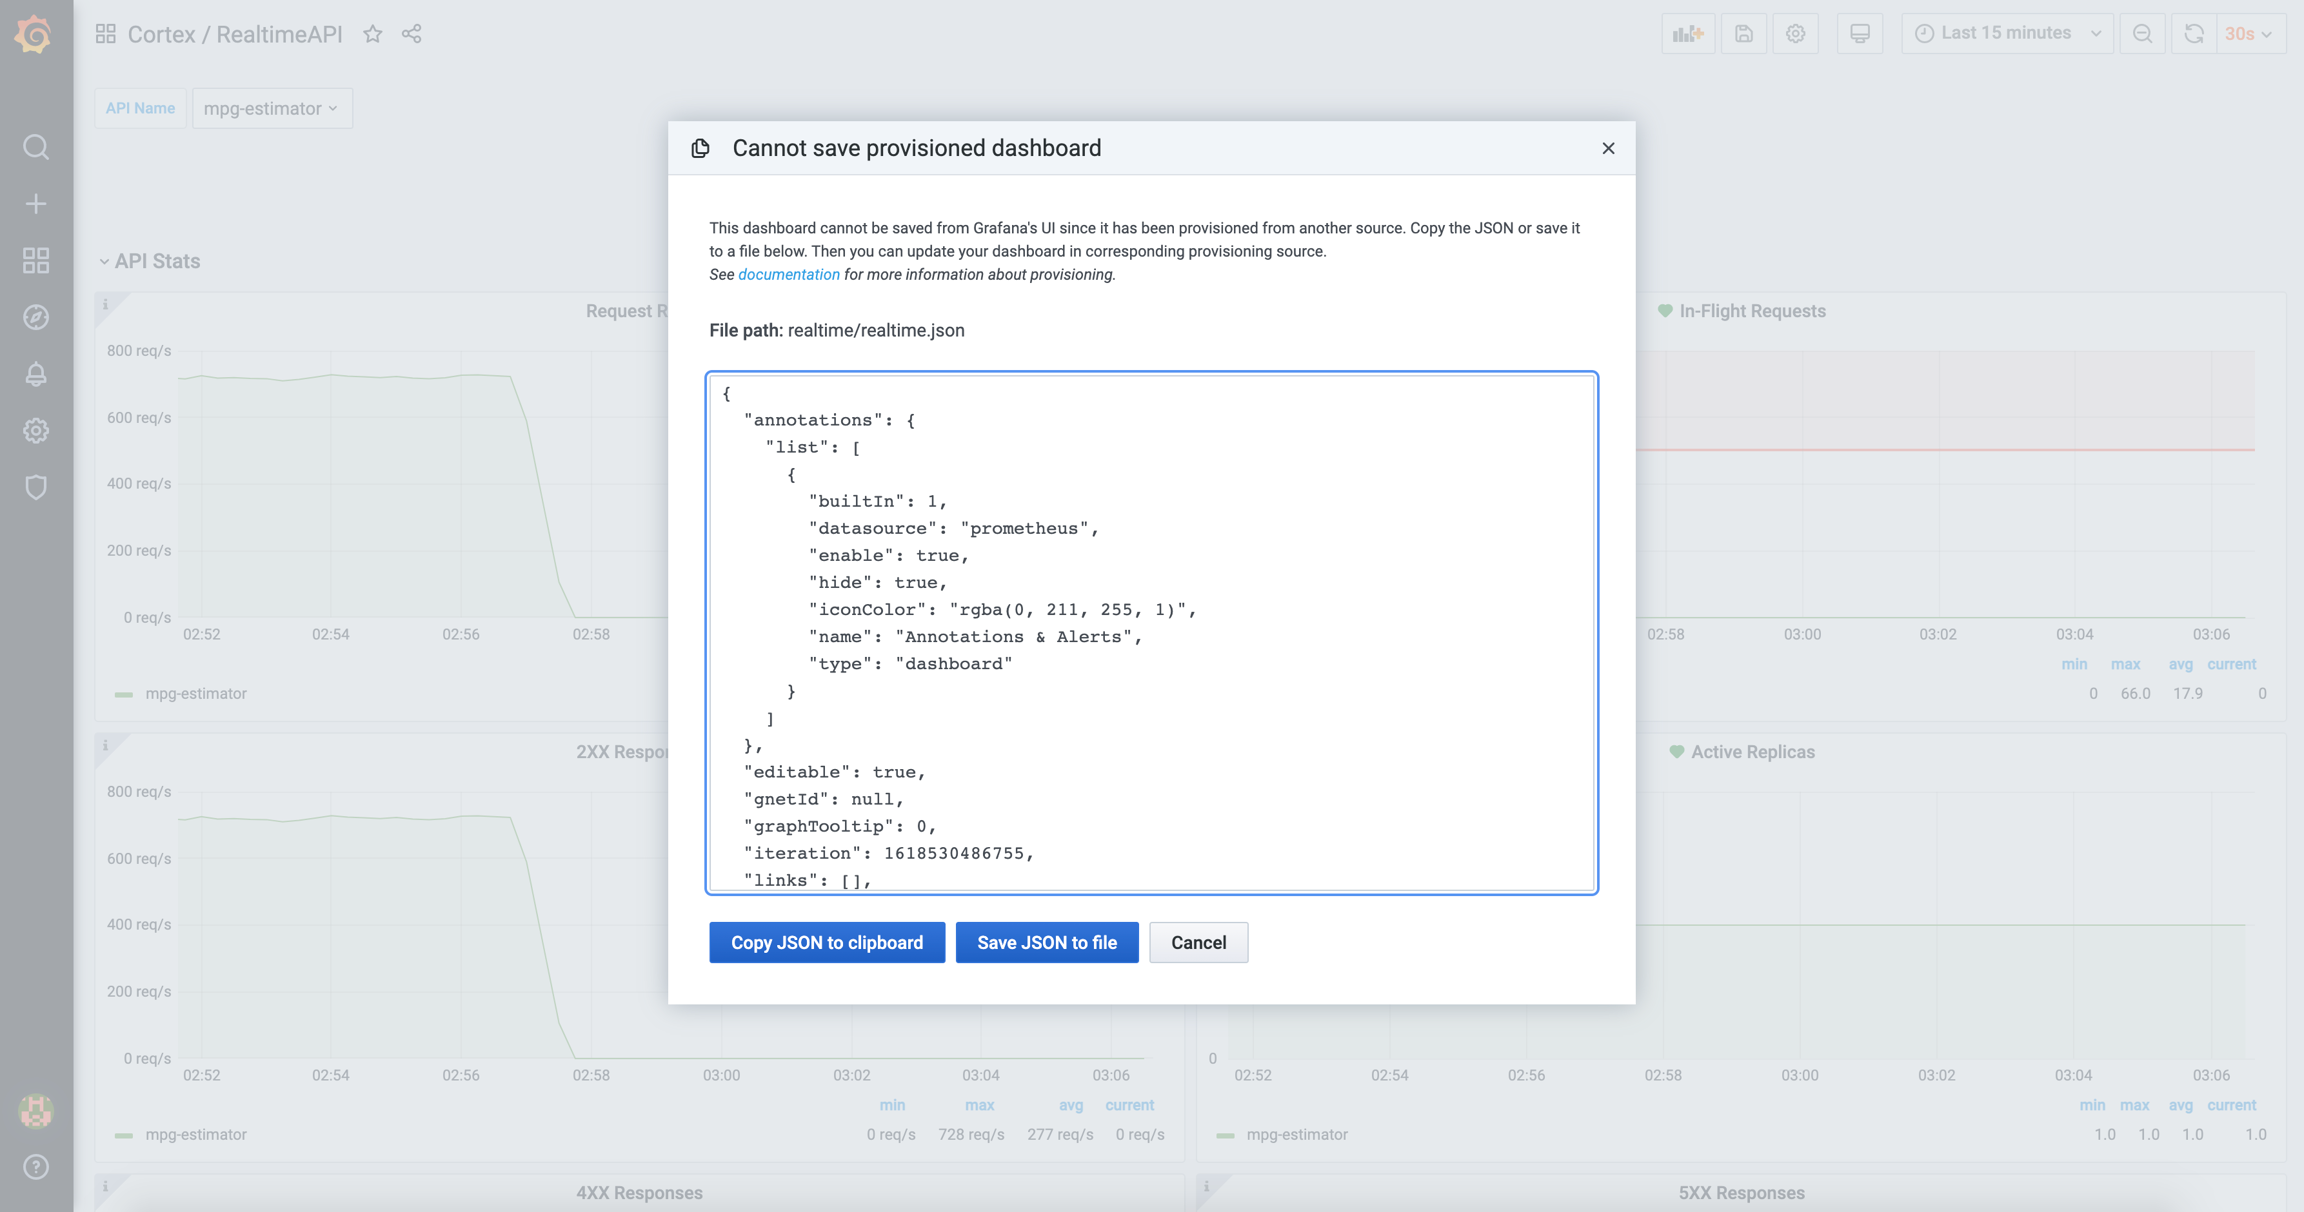
To save your changes permanently, go back to your dashboard and click on the save icon on the top-right corner.
Copy the JSON to your clipboard.
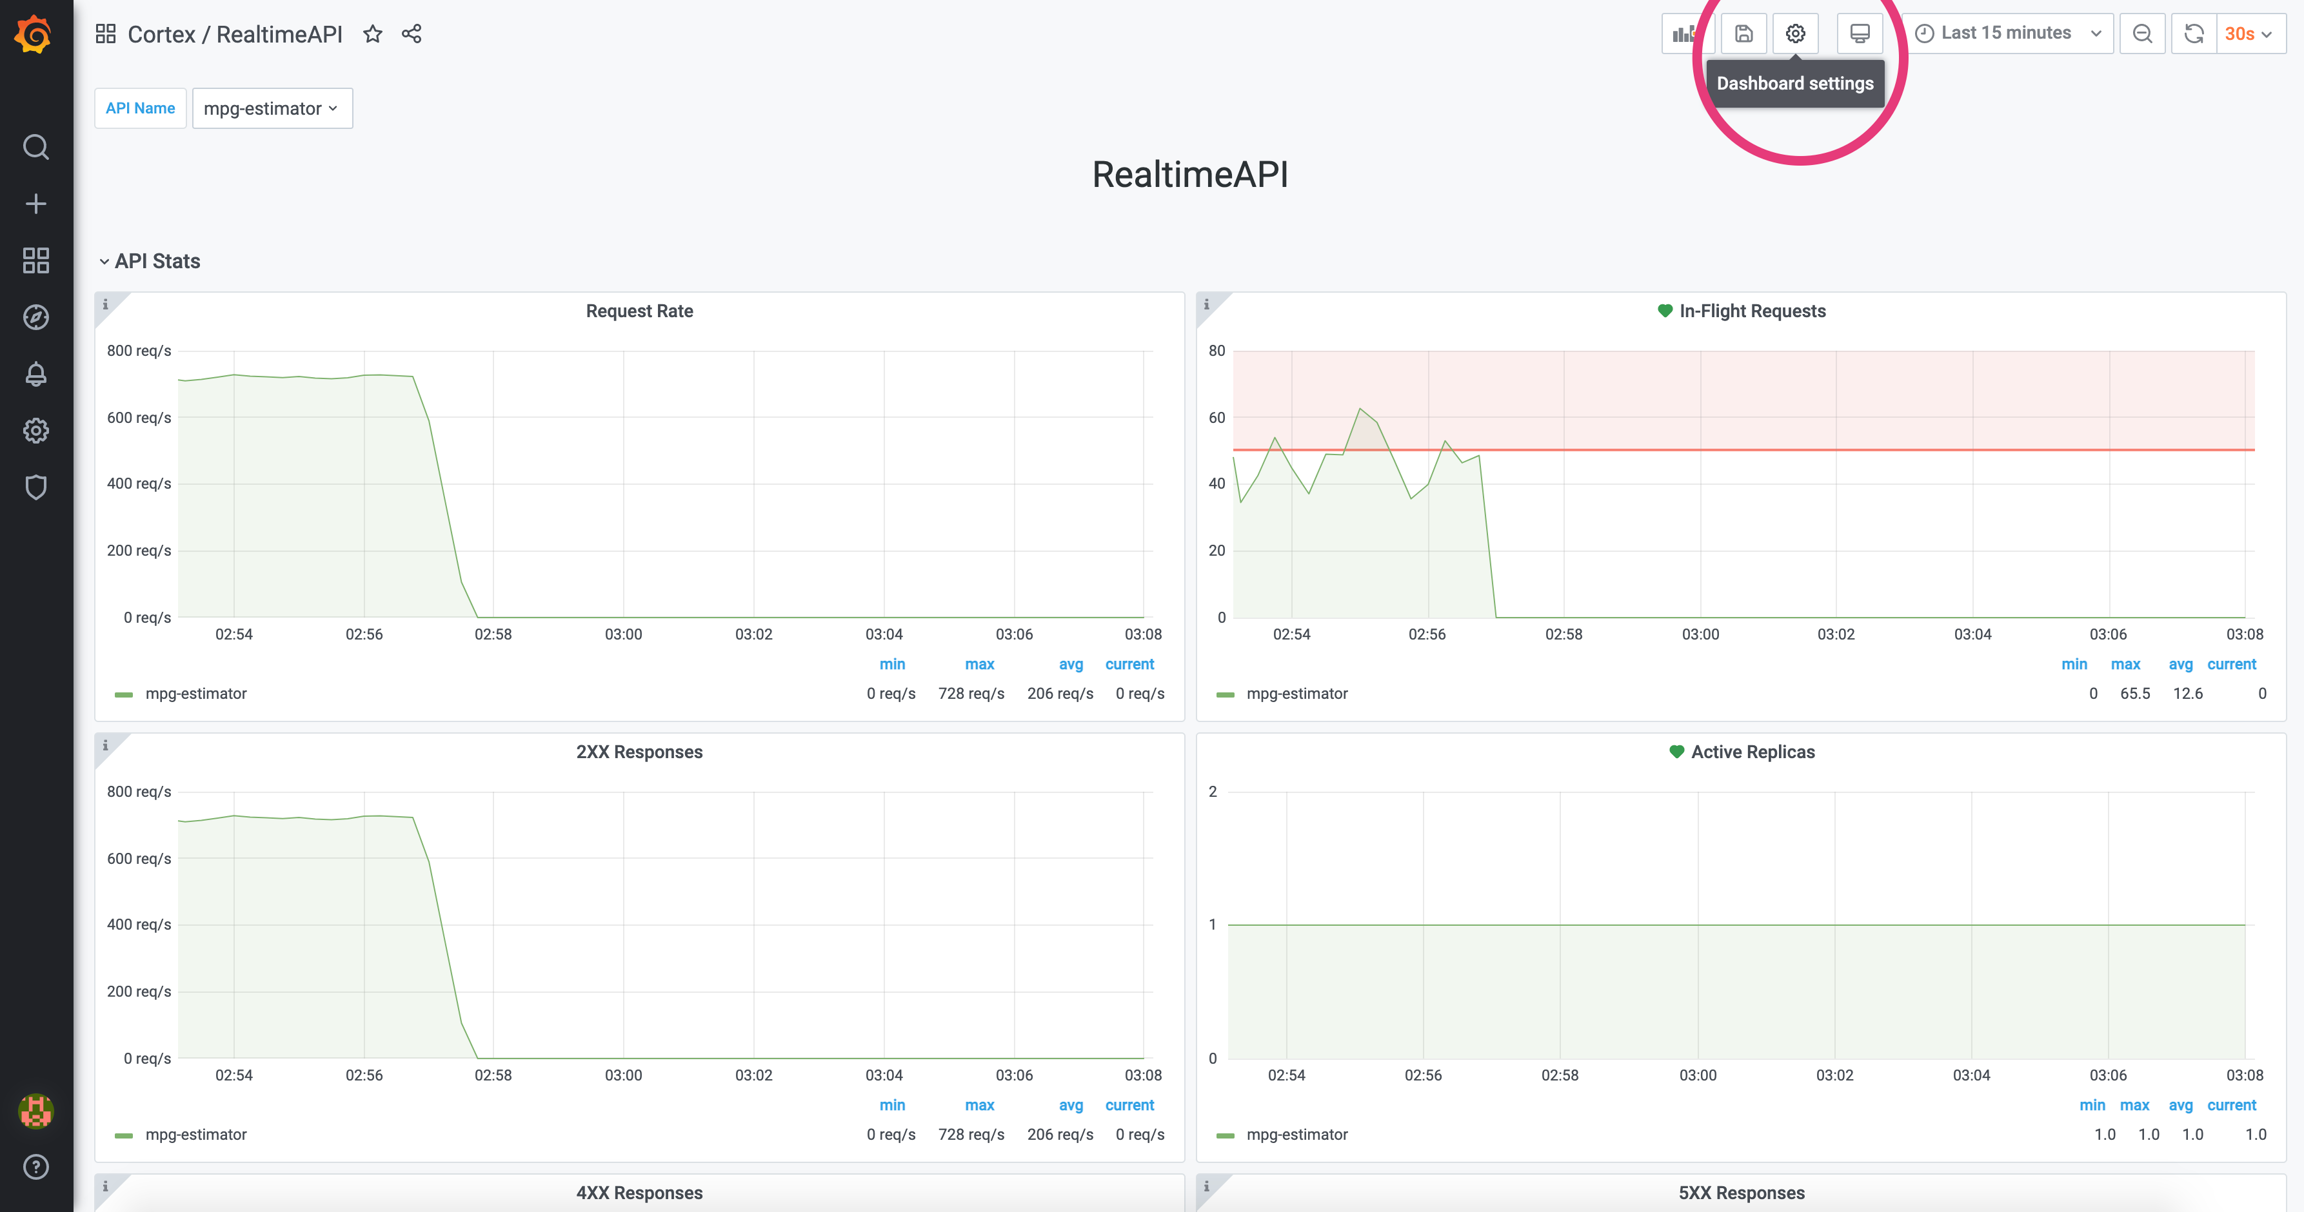
Click on the settings button on the top-right corner of your dashboard.
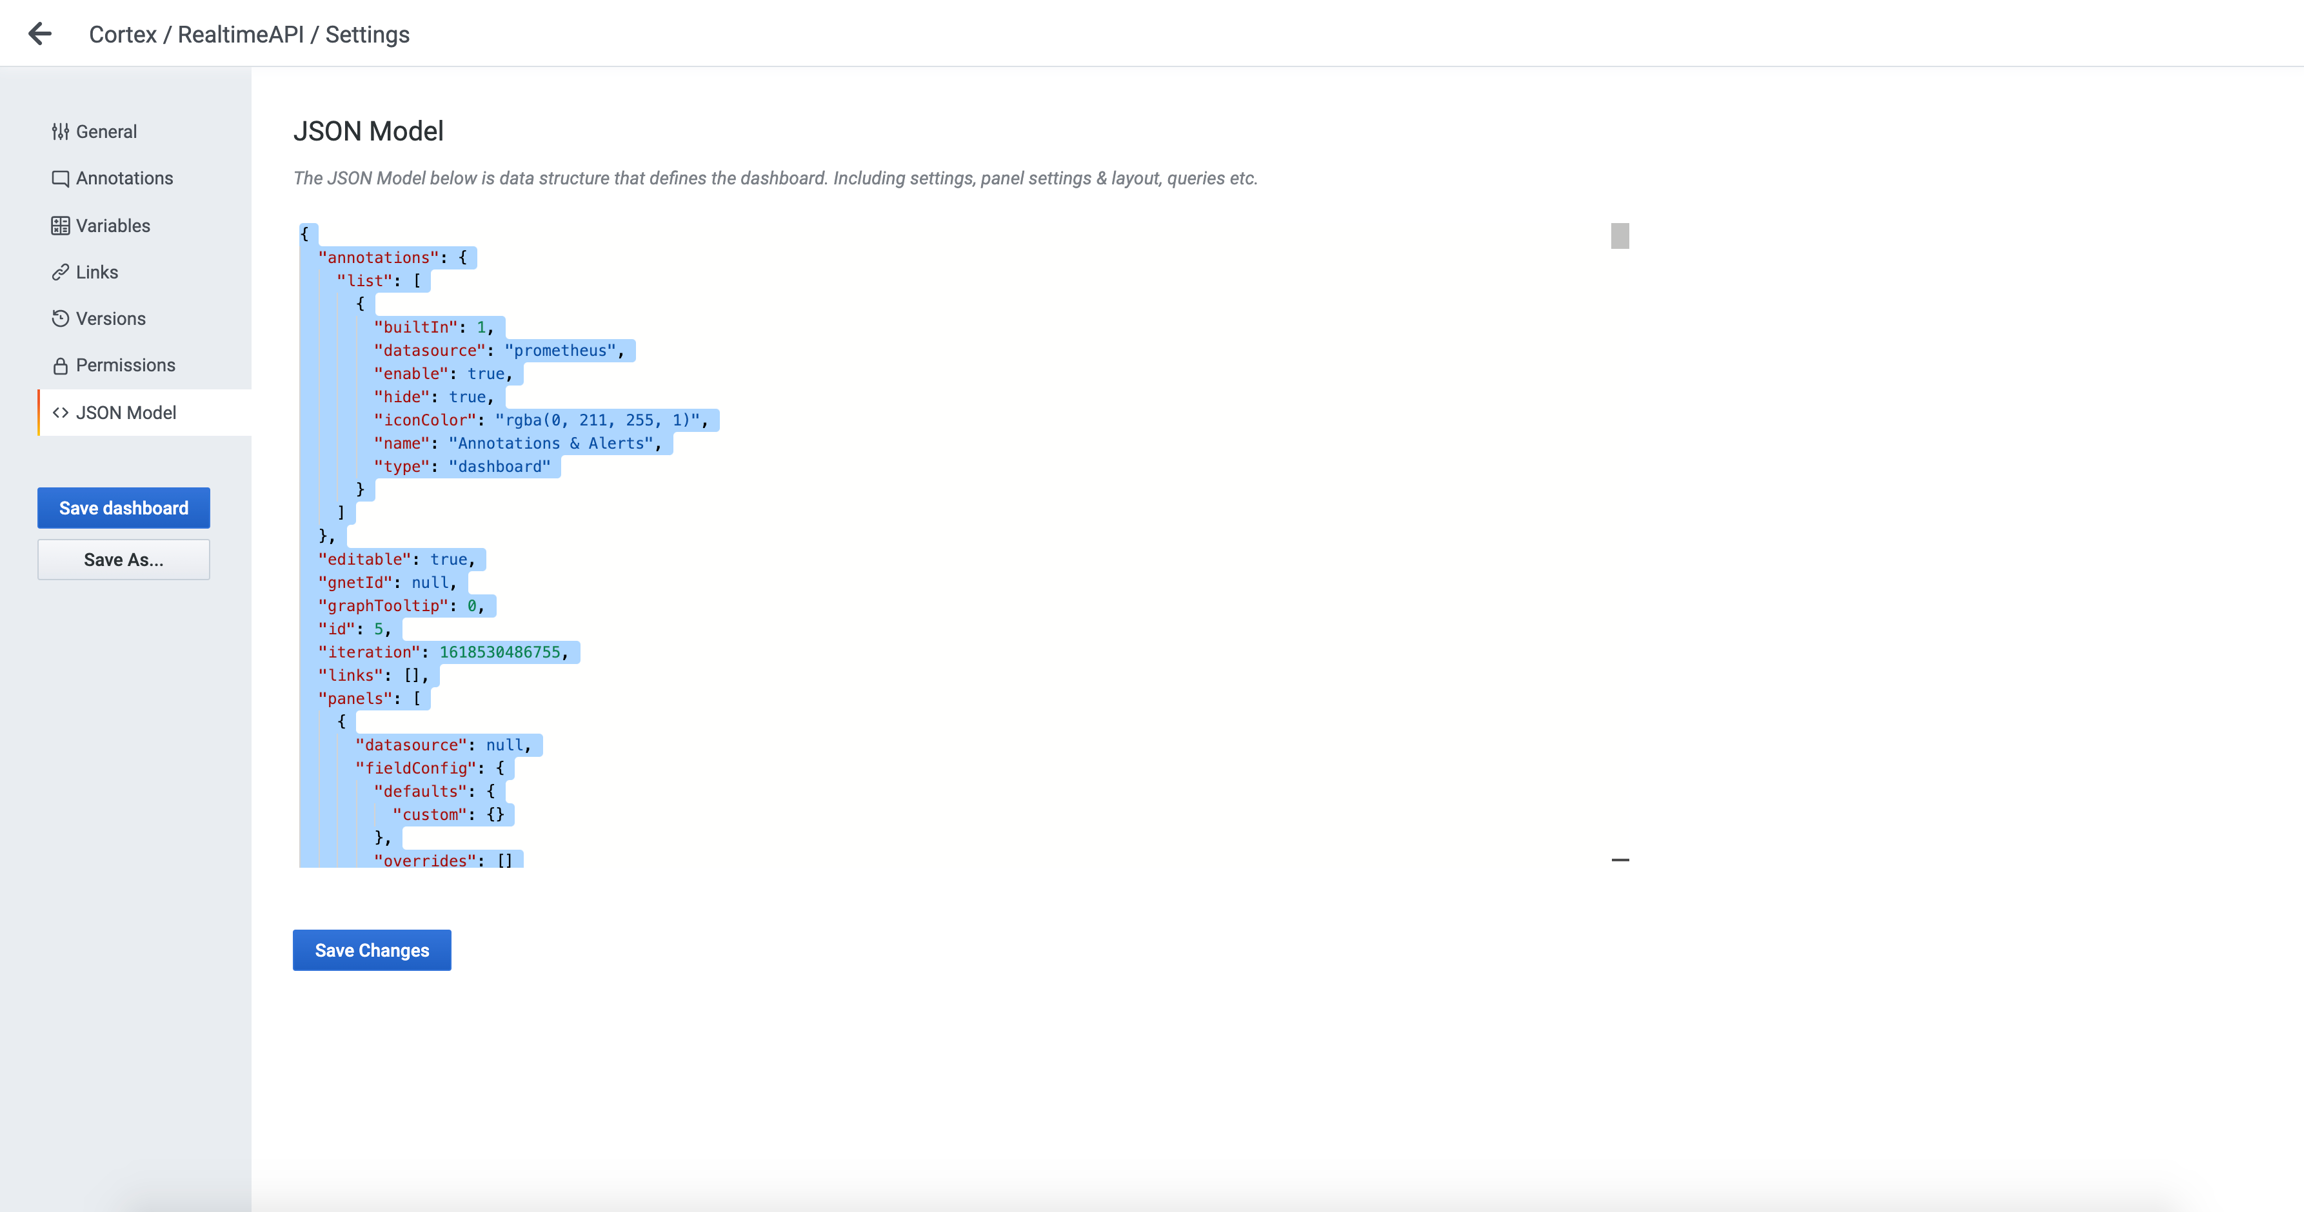
Go to the "JSON Model" section and replace the JSON with the one you've copied to your clipboard. Then click "Save Changes".
Your dashboard now has stored the alert configuration permanently.
Multiple APIs alerts
Due to how Grafana was built, you'll need to re-do the steps of setting a given alert for each individual API. That's because Grafana doesn't currently support alerts on template or transformation queries.
Enabling email alerts
It is possible to manually configure SMTP to enable email alerts (we plan on automating this process, see #2210).
Step 1
Install kubectl.
Step 2
The <SMTP-HOST> varies from provider to provider (e.g. Gmail's is smtp.gmail.com:587).
Step 3
Edit Grafana's statefulset by running kubectl edit statefulset grafana (this will open a code editor). Inside the container named grafana (in the containers section), add an envFrom section that will mount the SMTP secret. Here is an example of what it looks like after the addition:
Save and close your editor.
It will take 30-60 seconds for Grafana to restart, after which you can access the dashboard. You can check the logs with kubectl logs -f grafana-0.
Last updated