Metrics
Cortex includes Prometheus for metrics collection and Grafana for visualization. You can monitor your APIs with the default Grafana dashboards, or create custom metrics and dashboards.
Accessing the dashboard
The dashboard URL is displayed once you run a cortex get <api_name> command.
Alternatively, you can access it on http://<operator_url>/dashboard. Run the following command to get the operator URL:
If your operator load balancer is configured to be internal, there are a few options for accessing the dashboard:
Access the dashboard from a machine that has VPC Peering configured to your cluster's VPC, or which is inside of your
cluster's VPC.
Run
kubectl port-forward -n default grafana-0 3000:3000to forward Grafana's port to your local machine, and accessthe dashboard on http://localhost:3000 (see instructions for setting up
kubectlhere).Set up VPN access to your cluster's
VPC (docs).
Default credentials
The dashboard is protected with username / password authentication, which by default are:
Username: admin
Password: admin
You will be prompted to change the admin user password in the first time you log in.
Grafana allows managing the access of several users and managing teams. For more information on this topic check the grafana documentation.
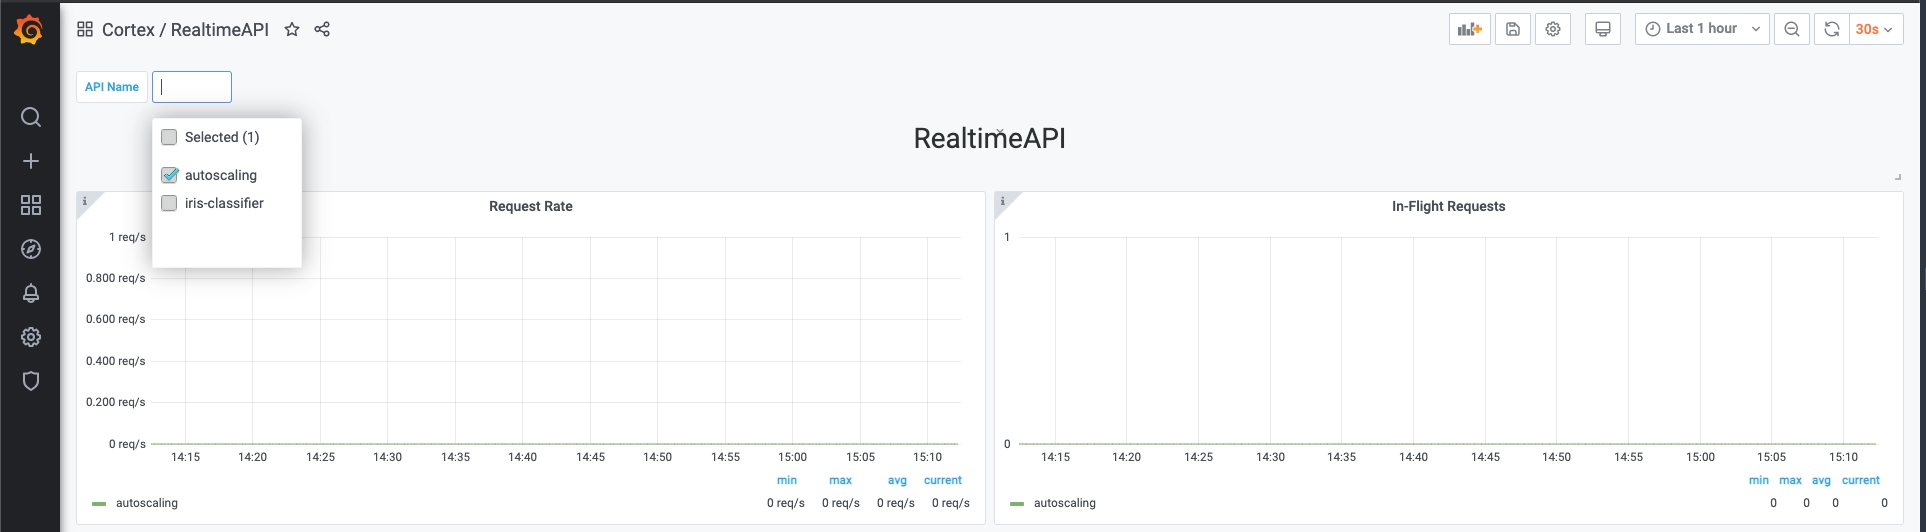
Selecting an API
You can select one or more APIs to visualize in the top left corner of the dashboard.
Selecting a time range
Grafana allows you to select a time range on which the metrics will be visualized. You can do so in the top right corner of the dashboard.
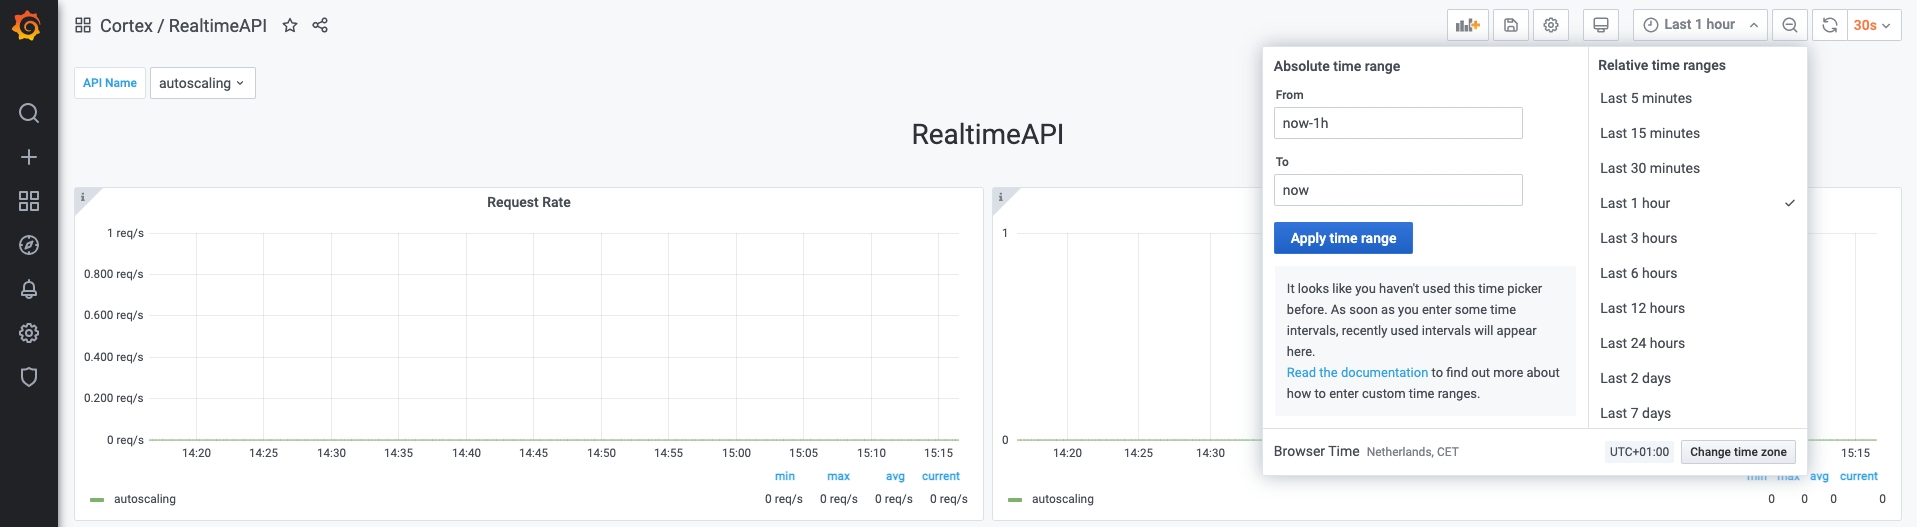
Note: Cortex only retains a maximum of 2 weeks worth of data at any moment in time
Available dashboards
There are more than one dashboard available by default. You can view the available dashboards by accessing the Grafana menu: Dashboards -> Manage -> Cortex folder.
The dashboards that Cortex ships with are the following:
RealtimeAPI
BatchAPI
Cluster resources
Node resources
Exposed metrics
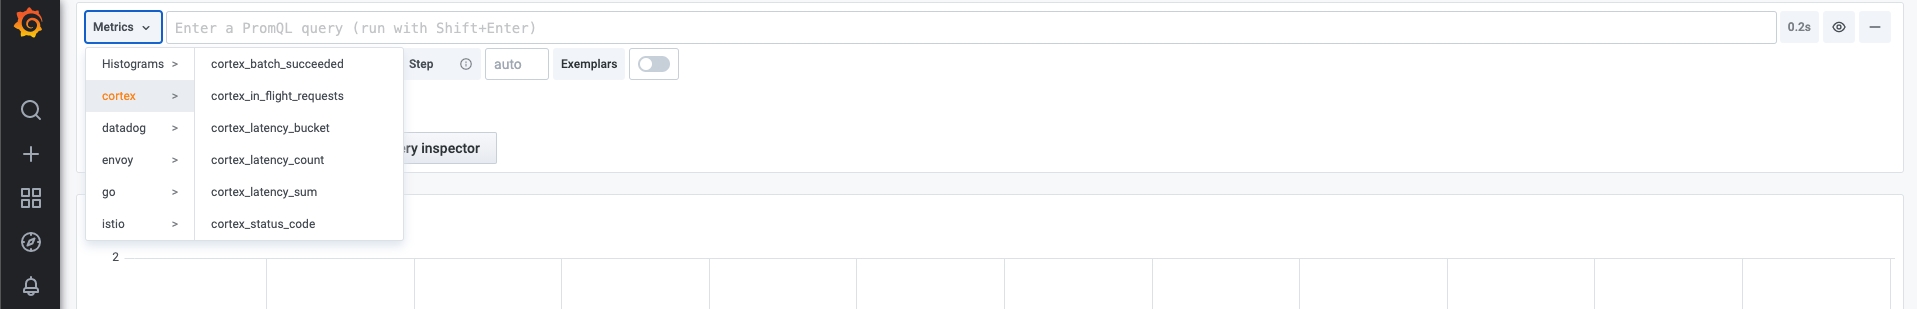
Cortex exposes more metrics with Prometheus, that can be potentially useful. To check the available metrics, access the Explore menu in grafana and press the Metrics button.
You can use any of these metrics to set up your own dashboards.
Last updated